





Phillip Dodson
UI/UX Web Developer
I wanted to thank you! IxDF is just the best thing ever. Just ever! Making this information accessible and available at the high level of qu...
Get excited to turn complex, hard-to-read data into clear visuals your team, clients, and stakeholders can understand and act on. According to the International Data Corporation, the world now generates well over 170 zettabytes of data a year. That’s more than 450 million terabytes every single day, and the figure keeps climbing. Big data and AI now let us find and access more than ever before, but all of that is only useful if we can make sense of it. Most people assume data work means heavy math and they count themselves out, but this course gives you a simple framework to turn raw data into visuals people instantly grasp, use them to drive decisions, and prove they actually work. No technical background needed. You already visualize information every day, like sketching a diagram to explain an idea or highlighting important points in a presentation. Whether you work in journalism, marketing, research, UX, or another field, this course will help you communicate complicated ideas quickly and clearly.
Make yourself invaluable as the professional who turns confusion into clarity. Anyone can make a chart, but few can design one that makes a situation instantly clear and drives a decision. In this course you'll learn Riccardo Mazza's five-step design framework, and work from defining the problem and the data, to choosing dimensions, mapping the underlying structure, and setting the right level of interaction. From there you'll master visual mapping, the deliberate pairing of data attributes with visual properties, and learn to represent everything from a single variable through multivariate data and hierarchies, using tools like concept maps and mind maps. You'll work with the three levels of interaction (static, transformable, and manipulable), so you can build anything from a fixed infographic to a model users explore for themselves. By the end, you'll have a repeatable process for turning any kind of data into a visualization that's clear and actionable.
Gain confidence and credibility as you learn to design using the science of human perception. MIT neuroscientists found the brain can process an entire image in as little as 13 milliseconds, far faster than it reads words or numbers. You'll see how vision and memory work. Then put them to use as you apply the Gestalt laws of grouping and preattentive attributes (the colors, shapes, and positions the brain registers first) so your visuals are understood at a glance. But fast doesn't mean accurate, and a visual can just as quickly send the wrong message. That's why you'll learn to test your work with real users, through heuristic evaluations, cognitive walkthroughs, interviews, and focus groups, so you can confirm whether it’s perceived the way you intended. You won't just hope your visualizations work, you'll know they do, and so will everyone who sees them.
Master complex skills with proven best practices and toolkits directly from industry leaders. Meet your expert for this course:
Alan Dix: Author of the bestselling book “Human-Computer Interaction” and Director of the Computational Foundry at Swansea University.
Industry giants trust our courses to train their teams, and prestigious universities integrate our content into their curricula. Add your certificates to your LinkedIn profile, résumé, and job applications.

I wanted to thank you! IxDF is just the best thing ever. Just ever! Making this information accessible and available at the high level of qu...

I thought the variety of videos and written material helped me learn much more efficiently. The instructor was knowledgeable and made it fun...

I really enjoy Alan's courses and find the way he teaches concepts through creative applications and case studies to be very useful.

I like the variation of reading and watching the lectures. Also, the instructor was extremely knowledgeable and engaging to watch. Answering...

The instructor is highly qualified, and the subject explanation is clear and crisp.

I thought the flow of the content was ideal. It is important to understand the history of visualization to understand how to use it and crea...

Alan Dix creates a positive and effective learning experience and has a deep understanding of the subject. He is very good!

Very articulate and well curated - lessons are in good bite-sized chunks.

The course is concise, to the point, and well-explained, making the content easy to understand and apply.
Industry leaders from companies like Adobe, Google, and NASA teach you real-world skills grounded in industry practice and research.
Learn both AI and the human-centered design skills that AI can't replace.
Add IxDF Course Certificates to your LinkedIn profile and résumé to show you've completed an evidence-based curriculum taught by industry leaders.
Use your new skills to take on higher-value work, qualify for promotions or find a role that fits you better.
Connect with designers in 497 cities across 107 countries. Learn together, get mentored, and build relationships that open doors.
High-impact design and AI skills
Learn from 210 industry leaders
42 evidence-based courses
161 one-hour Master Classes
Industry-recognized certificates
$2,189 worth of toolkits
10,218 active design jobs
10 structured career programs
Global community in 497 cities
$6,649 worth of premium tools
276 ready-made templates
and much more
Design skills are valuable for both you personally and for your company.
For you personally, design skills are important because:
Design roles are growing faster than average. The World Economic Forum ranks human-centered design among the fastest-growing skill areas through 2030.
Employers increasingly expect design skills across roles, not just from designers. Knowing design thinking, user research, or UX principles makes you more competitive in any field.
Designers who combine human-centered skills with AI expertise are in especially high demand.
For your company, design skills are important because:
Design skills help your team increase sales, retain customers, and improve customer satisfaction. Better customer experiences lead directly to better business results.
Companies that invest in design outperform the S&P 500 Index by 228% (Design Management Institute, Design Value Index).
Design is more than aesthetics. It's how teams make products easier to use, services more efficient, and technology more human. These skills create value across every department.
Design and tech skills can open up career opportunities.
For example, if you’re in a field such as:
Marketing, communication, HR, software development, customer service, business management, healthcare, teaching, and many more.
Why can design skills make you valuable in these jobs and industries?
That's because:
Design skills help your team increase sales, retain customers, and improve customer satisfaction. Better customer experiences lead directly to better business results.
Companies that invest in design outperform the S&P 500 Index by 228% (Design Management Institute, Design Value Index).
Design is more than aesthetics. It's how teams make products easier to use, services more efficient, and technology more human. These skills create value across every department.
Yes!.
You'll gain fluency in design processes and get job-ready, hands-on skills you can apply immediately.
This course makes it easy for you with templates and step-by-step guides, so you can easily present to managers and clients. All licensed for commercial use.
You’ll also learn to build an impressive portfolio.
Yes!
You’ll always have time for career growth because our course are self-paced and designed to fit into your busy life.
You can learn at your own pace. Anytime and anywhere, whether you're working full-time or juggling life and kids.
You can progress at a speed that feels just right for you.
Yes.
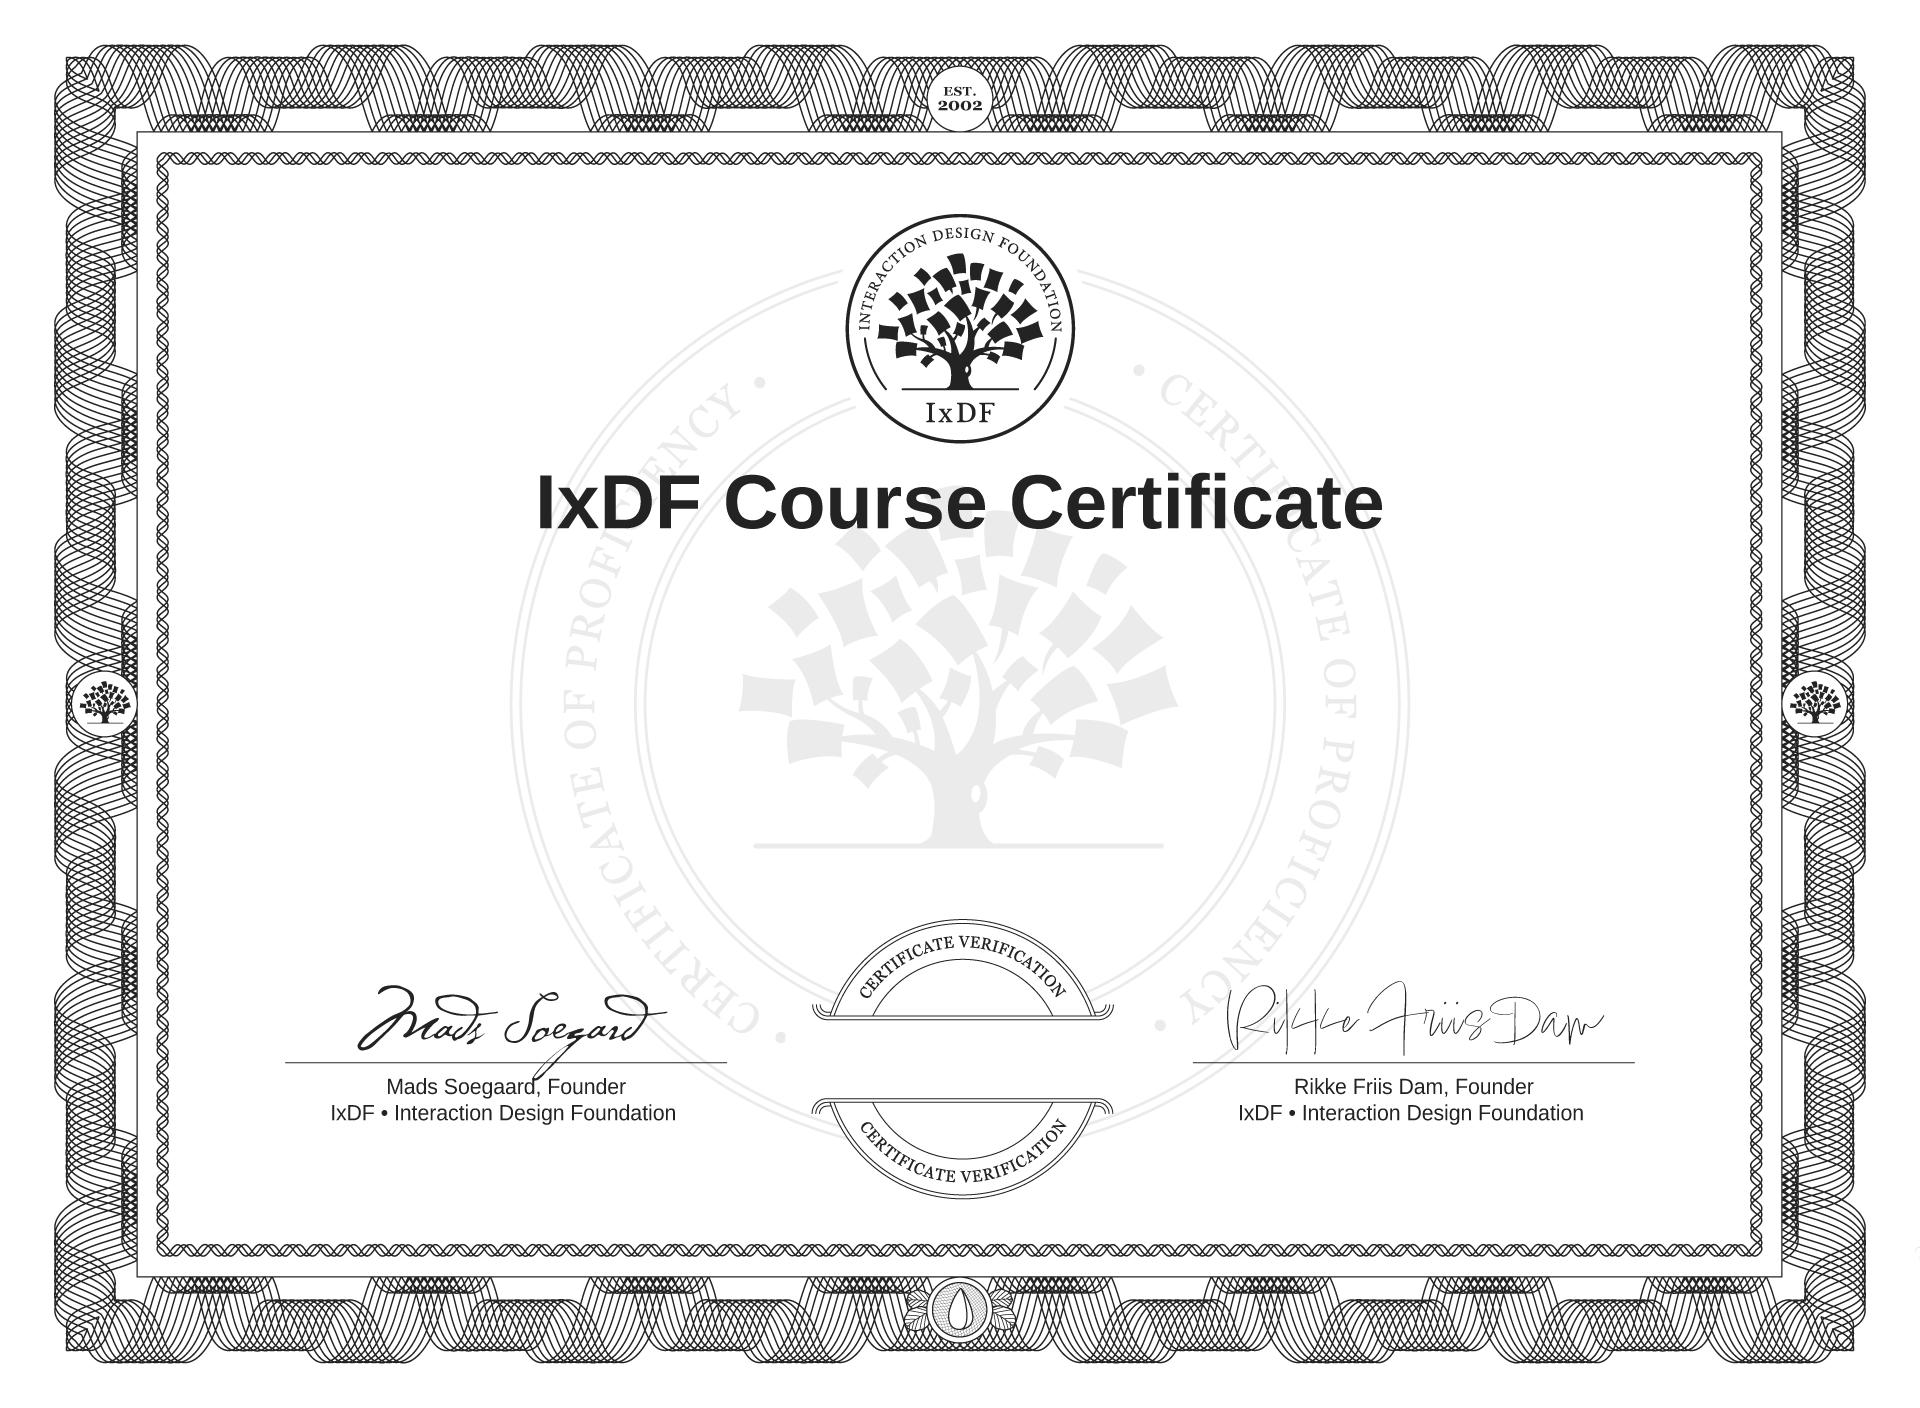
After you finish, you’ll receive an industry-recognized IxDF Certificate to prove you've completed an evidence-based curriculum taught by industry leaders.
Add IxDF Certificates to your LinkedIn profile, resumé and job application in a few easy steps.
You can download your certificates as .jpg files, so they are easy to share. Certificates are always valid.
Our grading is done by experts, not machines.
We make sure you receive feedback and maximum benefit from the entire process.
That’s also one of the reasons IxDF Course Certificates are credible and industry-recognized.
Yes.
You get unlimited access to all IxDF courses at no extra cost.
For example, if there are 40 courses open for enrollment, you can enroll in all 40 courses at the same time and move from one to another as you prefer. Use our IxDF Career Programs to help you choose the very best courses for you.
If you’re a student member, you can take a maximum of two courses at the same time. You can still take as many courses as you would like – free of extra charges – just as long as you finish them so that you don’t have more than two ongoing courses.
Yes.
You get unlimited access to all IxDF courses at no extra cost. Take as many courses as you want without paying extra. You can literally save thousands of dollars.
That's easy.
Add your IxDF Certificates to your LinkedIn profile, resumé and job application in a few easy steps:
Click “Add profile section” on your LinkedIn
Tap “Recommended”
Select “Add licenses or certifications”
Enter your IxDF Certificate details
Hit “Save”
You can download your IxDF Certificates as .jpg files, so they are easy to share. IxDF Certificates are always valid.
You can see the estimated total learning time just above.
But remember, it’s entirely up to you! You can learn at your own comfortable pace. Anytime and anywhere, whether you're working full-time or juggling life and kids.
Don't worry, we will re-run the course soon.
One reason we open and close courses is to achieve an optimal classroom size. That way, your networking opportunities and learning experience are optimal.
We display the "XX% booked" status on our courses to be transparent about the course availability.
Stay tuned for the next enrollment period. Be sure to sign up early! Meanwhile, you can sign up for another course you find interesting. Remember, you can take as many courses as you want without paying extra.
Our courses, master classes, and career programs cover everything from the fundamentals to advanced topics.
Whether you're completely new to design or an experienced professional, you'll find courses, master classes and career programs at your level.
We can help you in several ways.
Join meetups in your city: Join the regular meetups in your city in a nearby cafe or office building to have fun and learn with people just like you. You get full access to IxDF Local Groups where you can build your network, find new opportunities, or simply enjoy yourself in the company of people who are passionate about design. The meetings are completely optional and are spread across app. 500 cities worldwide.
You can also get instant help and career advice in the IxDF online members-only forums. Here, you can build your global network through our supportive community.
Yes.
Simply retake the course and keep moving forward!
Everyone's learning journey looks different and it’s about progress, not perfection.
To retake a course, just follow these steps:
Go to your profile and click on the course you'd like to retake.
Scroll down until you see the "Drop This Course" section.
Tap the button that says, "Drop My Course Now."
Head back to our Courses page and re-enroll yourself in the course.
You're all set to try again!
NB: Please note that when you drop a course, you’ll lose your progress and any answers you’ve already submitted in the course.
We’d love to hear from you and help you!
Reach out to us at [email protected] or use the online contact form.