Triangulation is when researchers combine multiple methods, data sources, investigators, or theories to confirm and validate their findings. Researchers use triangulation in user research to make sure results are accurate, reliable, and free from sampling issues, bias, or other error sources.
In this video, William Hudson, User Experience Strategist and Founder of Syntagm Ltd, explains methodological triangulation, one of the most common forms of triangulation.
The 4 Types of Triangulation
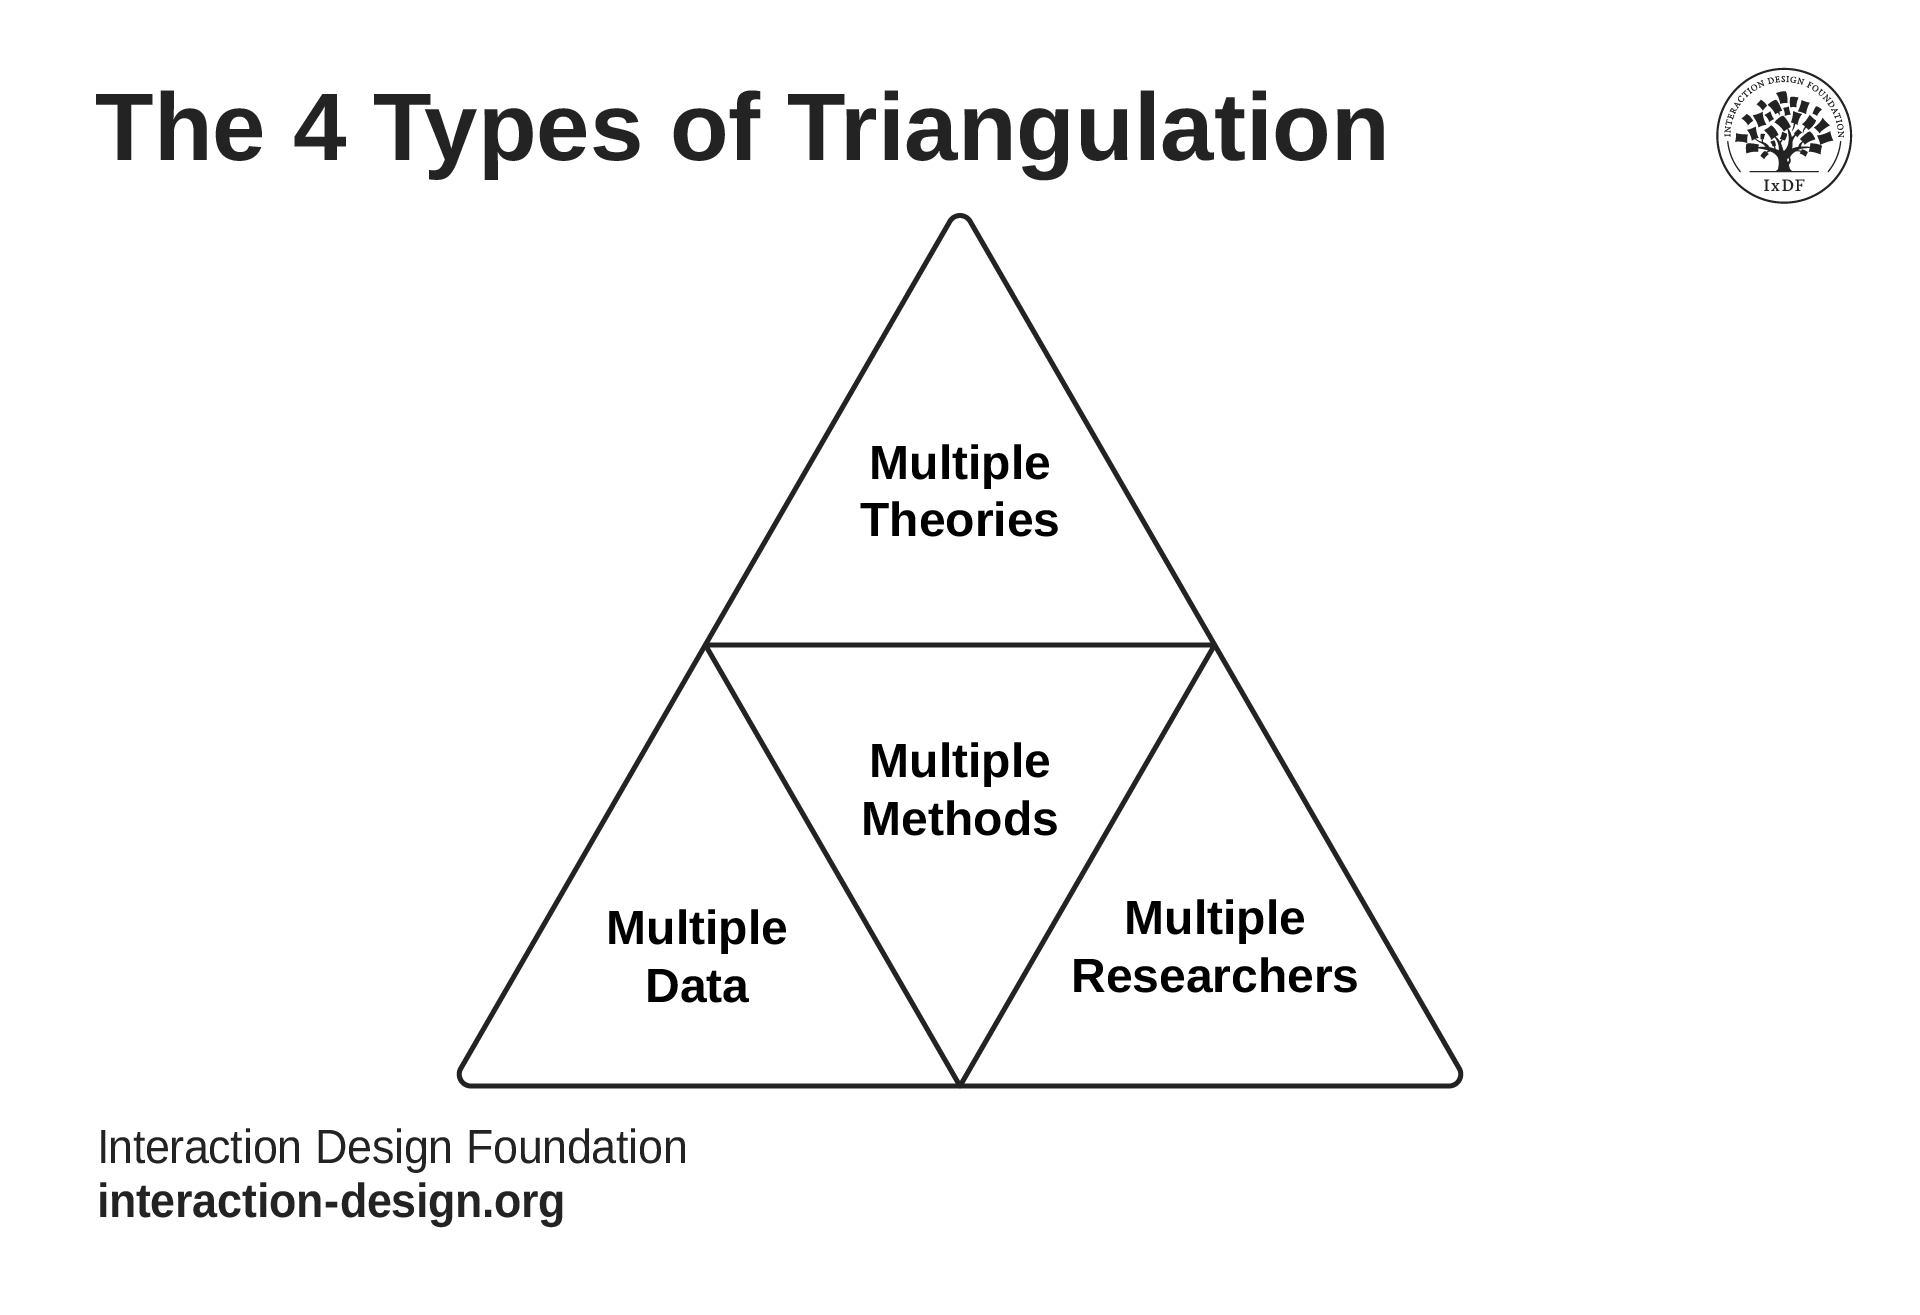
There are four primary types of triangulation: multiple methods, multiple data sources, multiple researchers, and multiple theories.
© Interaction Design Foundation, CC BY-SA 4.0
Here are the four most common types of triangulation:
Methodological Triangulation
In methodological triangulation, researchers use multiple data collection methods to support and validate each other. Example methods include:
Observations.
Interviews.
Analytics.
This approach helps ensure objective analyses and reduces researcher bias. It can also identify irregularities that might occur between collection methods. This is the most common form of triangulation and is called between-methodological triangulation.
For example, a researcher might observe five users for a new hotel check-in experience. Based on this qualitative research, they created a survey to confirm if the findings apply to a group of 50.
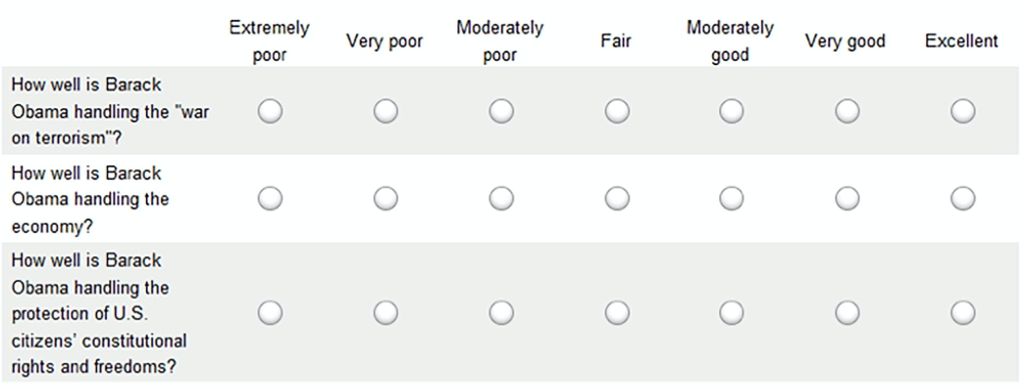
Another form of methodological triangulation is within-methodological triangulation. This approach uses multiple data collection techniques within the same overall research method. For example, a researcher may use several types of survey questions (Likert scales, multiple-choice, open-ended responses). This approach helps verify the consistency of user responses.
Data Source Triangulation
Researchers collect data at different times, places, and across population segments in data source triangulation. This comprehensive approach improves data consistency and helps researchers better understand their topic.
For example, a design team may be improving the service experience of a coffee shop. They conduct observations and interviews with customers at three different times of the day. Their findings paint a fuller picture of overall customer behavior.

One form of data source triangulation is to gather insights at interactive, aggregate, and collective levels. This approach provides a well-rounded understanding of how individual experiences contribute to collective customer satisfaction and business success.
© Interaction Design Foundation, CC BY-SA 4.0
When the sample size is small or the metrics are unusual, researchers often include more data from other sources. For qualitative research, they may include participants from different user groups. For quantitative research, they may look at clearer or more reliable metrics along with the unusual results.
Theory Triangulation
In theory triangulation, researchers apply different theories to their collected data during analysis to view it from different perspectives and gather insights. When researchers compare theories, it helps them better understand user behavior.
For example, customers of an e-commerce site may frequently abandon their carts. The researcher analyzes web analytics using behavioral economics and the Technology Acceptance Model (TAM). They compare their analyses and discover that combining insights from both theories offers a more holistic understanding of user behavior.
Researcher Triangulation
In researcher (or investigator) triangulation, research teams employ multiple researchers to collect data. If the researchers come to the same conclusions in their research, this can significantly improve the credibility of their findings. In large projects, this extends to multiple interviewers and analysts. Investigator triangulation is particularly effective at reducing the research team's individual biases.
For example, an individual researcher’s findings might differ from previous understandings in a study of user behavior with a productivity app. The design team introduces a second researcher to see if they get the same results or if the first researcher was introducing bias.
Triangulation and UX Design: Where Can You Use It?
In general terms, triangulation is beneficial in most research projects. It is invaluable to researchers relying on qualitative research, which is often true in UX. Triangulation helps to address issues with the small sample sizes typically used in user research activities. For example, in:
Persona research
Usability testing
Interviews
Grounded theory research
Design teams use triangulation when creating personas to discover deep, reliable user insights. This leads to personas that help teams align around a singular focus, make informed decisions, and create more successful products, services, and experiences.
© Interaction Design Foundation, CC BY-SA 4.0
In many cases, researchers use other sources to add confidence to qualitative findings. For example, surveys, web or app analytics, and UX metrics can address questions about user behaviors and needs. However, this is only possible for activities such as usability testing if comparable technical solutions are already deployed.
Also, it is not reliable to compare metrics from small-scale usability studies. Numerical results from fewer than 30 participants rarely have statistical validity. This means that the conclusions reached can result from sampling error, bias, or method rather than a reflection of user performance.
When to Use Triangulation and How to Choose the Best Type
The best triangulation method varies from one project to another and even over time in a single project. For example, the same research team may:
Use a quantitative research method, such as surveys, during the initial research for a new product to validate qualitative findings, such as those from user observations. This is an example of methodological triangulation.
Conduct user testing with multiple user segments to confirm if a reported difficulty with a particular feature is exclusive to one segment. This is an example of data source triangulation.
How researchers approach triangulation also depends on whether it is planned or ad hoc:
Planned triangulation is where researchers prepare multiple methods, data sources, investigators, and theories in advance. This approach allows design teams to incorporate the planned research into their budgets and timelines.
Ad hoc triangulation happens when researchers need to corroborate the results they have already collected or that have been presented to them. For example, the customer experience team may report that a few users are struggling with a certain feature. In this scenario, researchers may use ad hoc methodological triangulation to produce a survey to collect data from a larger number of users to determine if this is a wider issue.
When to Use Methodological Triangulation
In user research, methodological triangulation is a common type of triangulation. Researchers frequently use quantitative methods to support qualitative findings. They conduct qualitative research in the early stages of a project, for example, user interviews. They then collect quantitative data through:
Methods such as surveys or closed questionnaires.
Analytics, such as those from existing apps or website analytics.
Related or similar projects that have available data.
In this video, William Hudson, User Experience Strategist and Founder of Syntagm Ltd, explains the difference between qualitative and quantitative methods and the pros and cons for each.
Researchers use methodological triangulation in both planned and ad hoc situations. Here are some example scenarios:
You’ve completed planned qualitative research and want to confirm if your findings apply to more users.
You’ve heard about an issue from a small number of users and want to determine whether it’s a wider issue.
You need to make an important business decision based on your qualitative findings and want the reassurance that quantitative data brings.
When to Use Data Source Triangulation
Data triangulation is effectively built into all but the smallest research projects. When researchers choose their participant samples, they ensure they have a broad enough range within the user population segments they are studying. Even when design teams use personas to focus on a narrow set of user needs and behaviors, their research aims to build a complete picture of their user base since this will include a diverse range of skills and abilities.
In ad hoc situations, researchers introduce further data sources to build confidence in their findings. Here are some example scenarios:
You’ve conducted a series of user observations, and your participants did not behave as you expected.
Your research participants were divided 50/50 on a particular topic, and you need fresh participants to see if this is a common occurrence.
Your research revealed that your participants behaved differently in a group than individually, and you want to study group behavior in more detail.
When to Use Theory Triangulation
When researchers cluster and analyze data, gaps or inconsistencies can arise as they construct theories to explain the studied behavior. When this happens, they may approach their data with alternative or additional theories. For example, some participants may exhibit satisficing behavior, where a choice is adequate rather than optimal. In cases like this, the researcher may split the data into smaller parts and test each part separately against different theories to check if they need multiple theories to fully explain the data.
While researchers may plan to use theory triangulation in their projects, its need occurs more on an ad-hoc basis. For example:
You notice your findings could be understood differently depending on which theory you use.
Your data aligns partially with an existing theoretical framework, but some findings remain unexplained.
The topic you're studying is highly complex, and relying on a single theory feels inadequate.
A useful theory for interpreting data is behavioral economics. It provides a lens on how biases, heuristics, and choice architecture shape real-world decisions. Find out more in this video.
When to Use Researcher Triangulation
Multiple researchers are inherent in many medium to large-sized research projects. When multiple researchers are involved, they must have an agreement between them on the research goals. They must also allow individual experience to add multiple perspectives and robustness to the research.
In ad hoc situations, design teams add researchers when they believe researcher bias was introduced in their initial study(s). For example:
The data you or another researcher collected seems skewed toward a particular angle not previously revealed in other research.
You or another researcher had a strong emotional reaction to the answers given by research participants, and you believe it has affected how the data was recorded.
The results of your study directly contradict existing research or widely accepted conclusions.
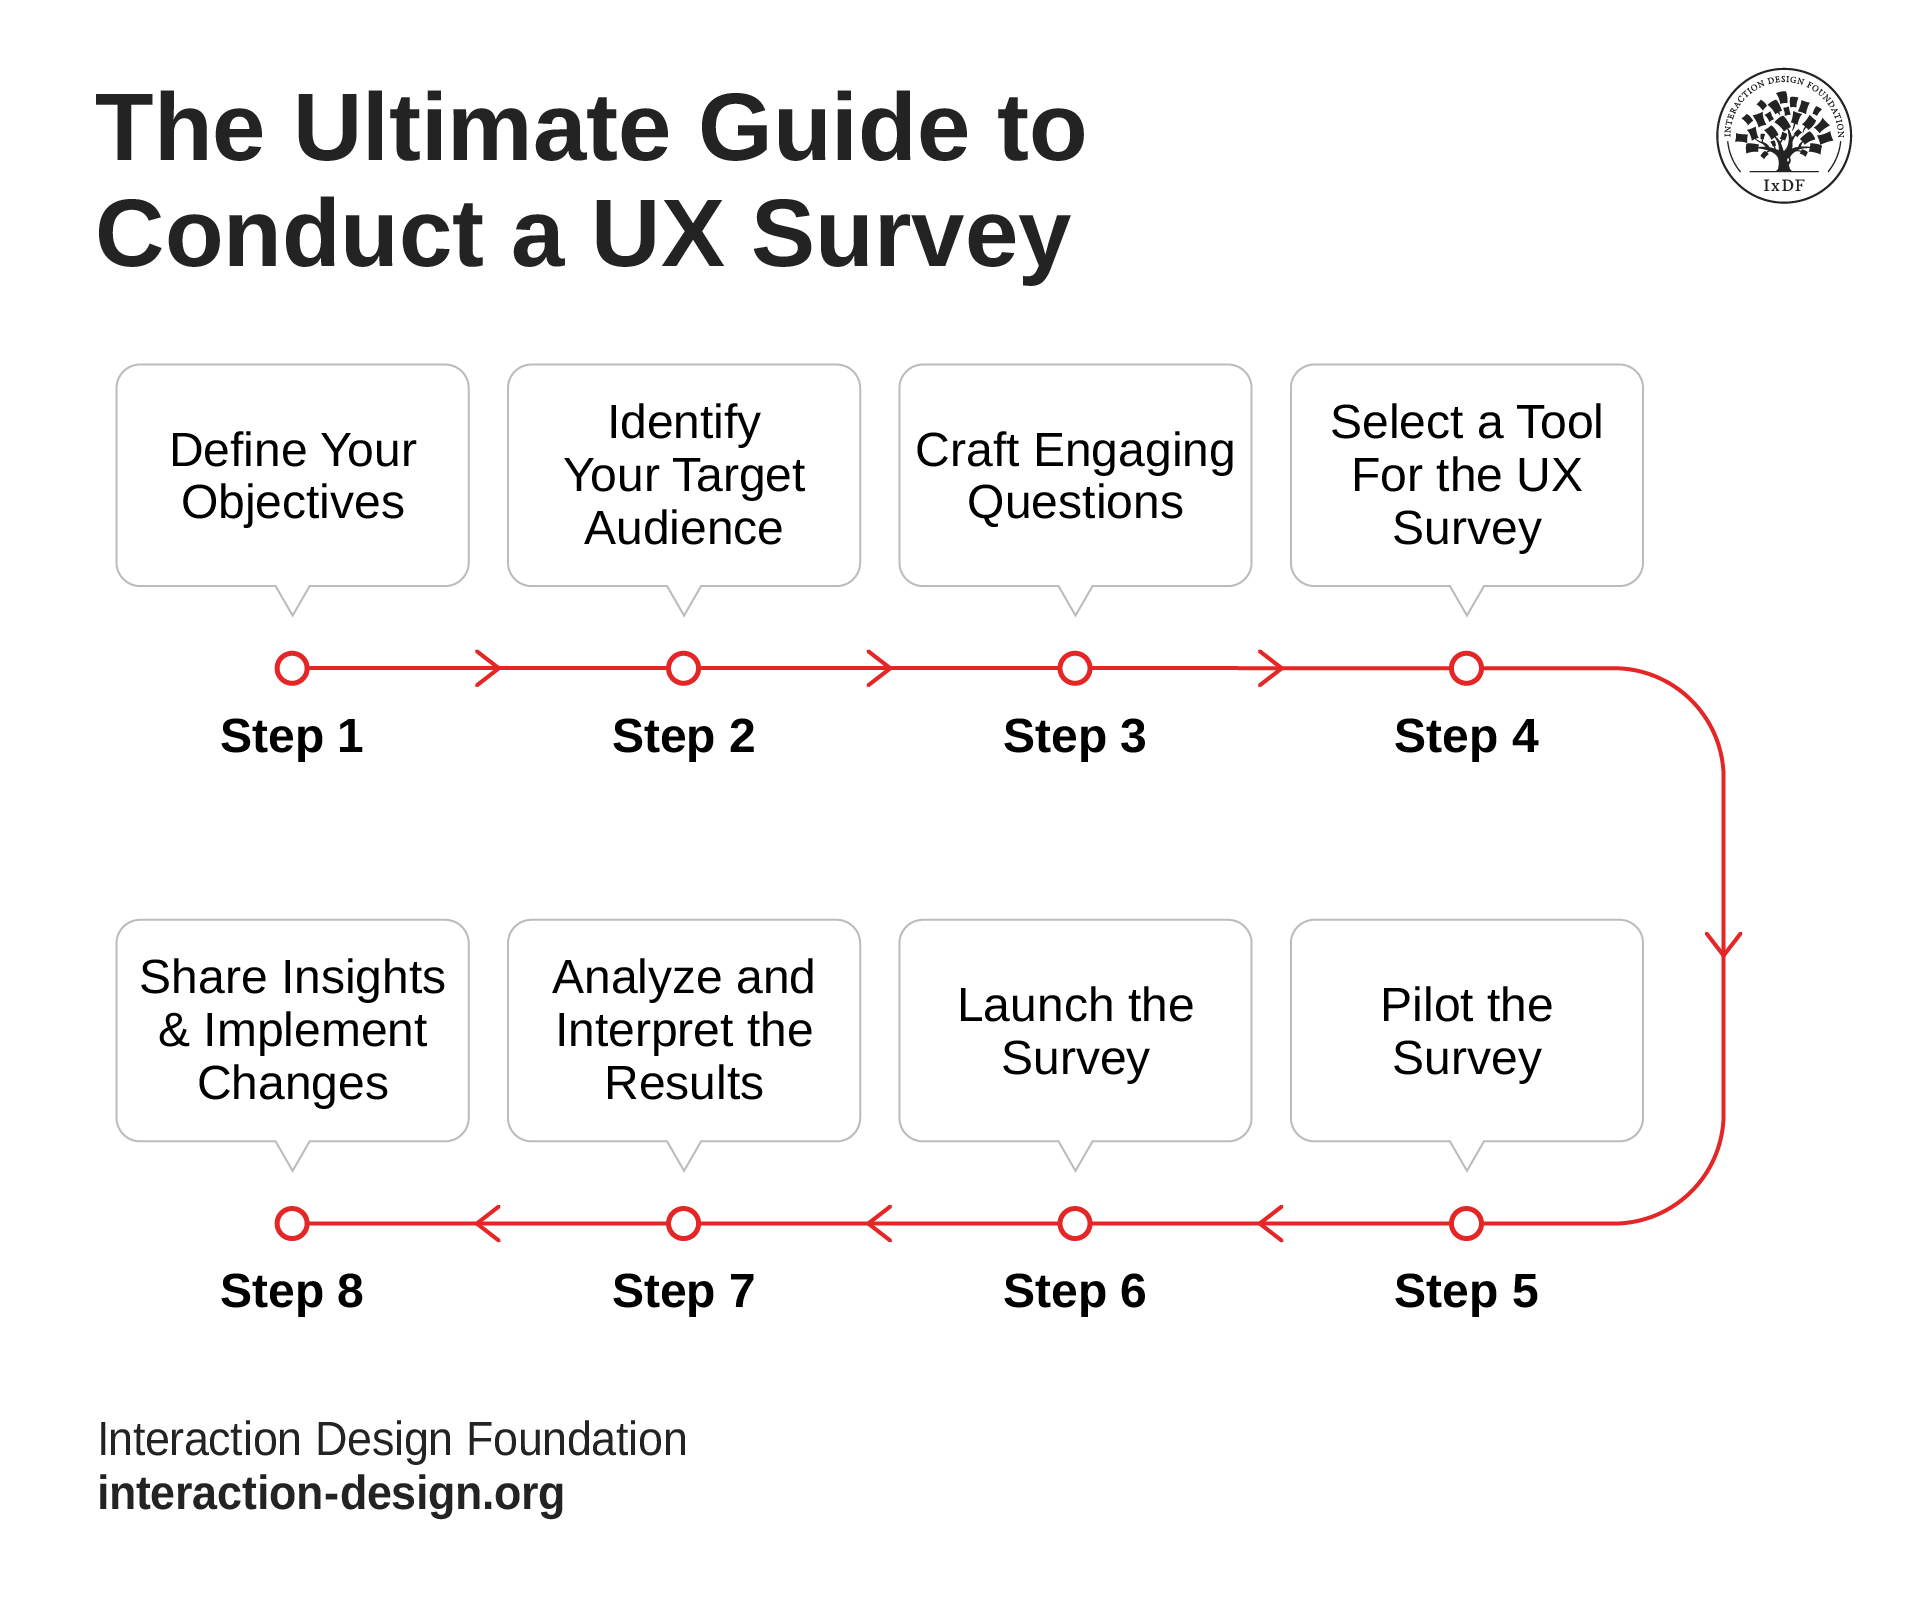
How to Use Triangulation in User Research: Step-by-Step
Triangulation helps ensure your user research findings are reliable and robust by cross-verifying data from different methods, sources, researchers, and theories. Follow these steps to integrate triangulation into your next research project.
Step 1: Clearly Define Your Research Question
Start with a specific and clear research question. This will help you determine exactly what you need to validate through triangulation. Here are some examples:
How do remote workers stay productive in home environments?
What motivates users to abandon online shopping carts before checkout?
Why do users prefer one social media platform over another for sharing personal experiences?
Step 2: Apply the Four Types of Triangulation
You can use one or all four triangulation methods in your research projects. Most user research projects use method and data source triangulation. Most larger projects use researcher triangulation. For more complex data, researchers introduce theory triangulation.
1. Methodological Triangulation
Decide whether to use between-method, within-method, or both. Between-method is very common in user research projects, and you can implement some simple forms of within-method in your surveys and interview questions.
Between-Method Triangulation
Plan the methods you will use or choose a method that complements your existing data. For example:
I will interview remote workers about their daily routines, send them a survey about productivity and distractions, and review data from productivity apps to check their responses.
I will conduct usability testing to observe user interactions during checkout, run a survey asking users about their reasons for cart abandonment, and analyze web analytics to identify the exact points where users frequently leave the checkout process.
To complement my interview data on user social media preferences and motivations, I will perform sentiment analysis on social media posts to identify patterns in emotional expression across platforms.
Researchers often use surveys to confirm their qualitative findings. However, quantitative results are rarely adequate as the main focus of research. They provide little information regarding user needs and behaviors.
© Interaction Design Foundation, CC BY-SA 4.0
In ad hoc situations, you can scale the method to your immediate needs. Sometimes, extensive research is not necessary. For example, you may only need to survey ten users to establish the main cause of a sudden loss of conversions, such as unsuccessful checkouts or sign-ups.
Within-Method Triangulation
Decide how you will introduce within-methodological triangulation to your chosen research methods. For example:
During interviews, I will first ask remote workers directly about what helps them stay productive. Later in the same interview, I will ask similar questions differently, such as what routines or habits make their workday successful, to confirm their answers.
In my survey, I will first ask users directly why they abandoned their shopping carts. Later in the same survey, I'll reword the question by asking them to choose the top reasons from a list of common issues, like shipping costs or complicated checkout processes.
2. Data Source Triangulation
Expand data collection beyond your main target group or location:
Who: Include varied participants. For example, "I'll survey freelancers, corporate remote employees, and hybrid workers to compare experiences."
Where: Collect data from multiple locations. For example: "I'll collect data from both central and out-of-town areas to avoid location biases."
When: Collect data at different times. For example: "I'll gather data at multiple points throughout the day to avoid rush-hour biases."
Participant screening is an essential part of the research process. Unsuitable participants can introduce bias and make your data unreliable. In this video, William Hudson, User Experience Strategist and Founder of Syntagm Ltd, explains the best practices for screening participants.
You may also examine insights at interactive, aggregate, and collective levels. For example:
Interactive Level: Individual user behaviors. For example, “A customer orders coffee, checks their phone, and leaves in 10 minutes."
Aggregate Level: Patterns within groups. For example, "Student groups stay longer and order more, whereas solo customers leave quickly."
Collective Level: Overall trends across all data. For example, "The café is busiest in the morning; most customers prefer seats near power outlets."
3. Researcher Triangulation
Cross-validate your findings by introducing multiple researchers to reduce bias:
Identify Research Partners: Clearly define who you will collaborate with. For example, “I will collaborate with two colleagues: a behavioral psychologist and a UX researcher.”
Agree on Observations: Record agreements among researchers to strengthen findings. For example, “Both researchers observed that structured breaks improved remote workers' productivity.”
Explore Disagreements Further: Investigate discrepancies in observations. For example,
"One researcher noticed social isolation as an issue, while another did not. To investigate further, we’ll add specific questions about loneliness in our survey."
4. Theory Triangulation
In exploratory research and discovery, theories typically emerge later in the data collection process. For example, if you are using grounded theory. However, researchers may derive theories of user behavior through alternative data collection, such as web analytics or UX metrics. Plan to have alternative sources to guide you when new theories arise during qualitative research.
Learn more about grounded theory, a research approach to reduce bias in your findings, in this video.
Also, be prepared to adjust your theories in the face of new data. Situations, technology, and users change. If you have confidence in your data through other forms of triangulation, consider alternative or additional theories to account for these variations.
Here’s how to apply theory triangulation:
Choose Theoretical Perspectives: Pick two or more theories relevant to your research. For example, "Cognitive Load Theory will help assess mental fatigue, while Self-Determination Theory will evaluate motivation."
Compare Interpretations: Observe how different theories affect your findings. For example, “Cognitive Load Theory suggests distractions lower productivity; Self-Determination Theory suggests autonomy increases it. Comparing both clarifies if motivation or distraction is more critical."
In some cases where competing theories seem likely, other forms of triangulation may be more useful than trying to fit inconclusive research into a specific theory. For example, a researcher may collect more data (data triangulation) or check that researcher bias is absent (researcher triangulation).
Step 3: Validate and Strengthen Your Conclusions
Confirm consistent insights across triangulation methods, note contradictions, and plan further investigation:
Consistency Check: Look for patterns appearing across methods. For example:
"Surveys and interviews both show structured schedules improve remote worker productivity."Address Contradictions: Identify and resolve data inconsistencies. For example:
"Analytics data contradicts survey results regarding schedules. Conduct follow-up interviews to clarify."Further Research: Suggest additional methods or data collection to enhance reliability. For example: "I will add observational studies of remote workers' daily routines to verify self-reported productivity data."
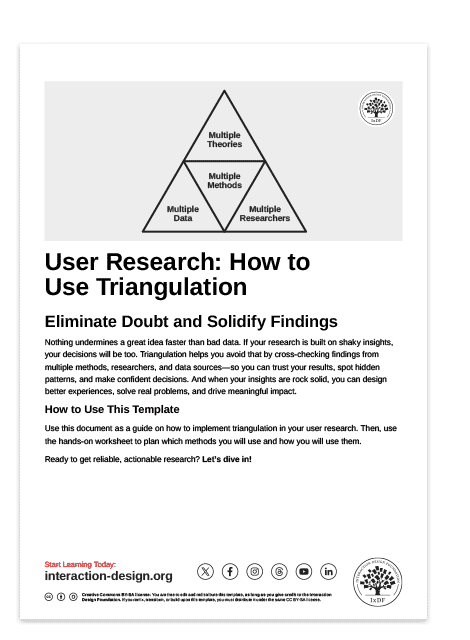
Free Template: Implement Triangulation in Your Projects
Download this handy template to implement triangulation in your research and build confidence in your results. It includes an overview of the four types of triangulation and a step-by-step fillable guide to help prepare your research plan.