Your constantly-updated definition of UX Tools and collection of videos and articles. Be a conversation starter: Share this page and inspire others!
596 Shares
What are UX Tools?
User experience designers use UX tools—often purpose-built software—at different stages of their work. For example, designers test their assumptions using prototyping software (e.g., Balsamiq) and do usability testing with other software (e.g., Loop11). To stay competitive, brands make UX tools extremely easy to learn.
"The specific tool doesn't matter quite as much, because the tools change all the time. So, you want somebody who can quickly learn new tools."
— Daniel Rosenberg, UX Professor and Executive
Transcript
Transcript loading ...
See why what you know and how to do it is more important than the UX tools you use.
Several Levels of So Very Many UX Tools
Throughout the stages of the UX design process designers use tools to help create digital or physical representations of their ideas. “UX tool” may refer to any technology you use this way – be it to apply design principles in prototyping or simply record ideas. At the lower levels, UX tools are basic aids such as the markers, Post-its and whiteboards teams use during brainstorming sessions. Similarly, you use physical UX tools when you do paper prototyping.
At the higher levels, UX tools are the software you use to advance your and your team’s ideas – ranging from free to premium options. You can divide these between software that helps in copywriting (e.g., Grammarly), team collaboration (e.g., Dropbox) and various other types of tools:
Flowcharting tools – To help predict users’ needs, thoughts and actions and align these with business needs through flowcharts: E.g., LucidChart, OmniGraffle.
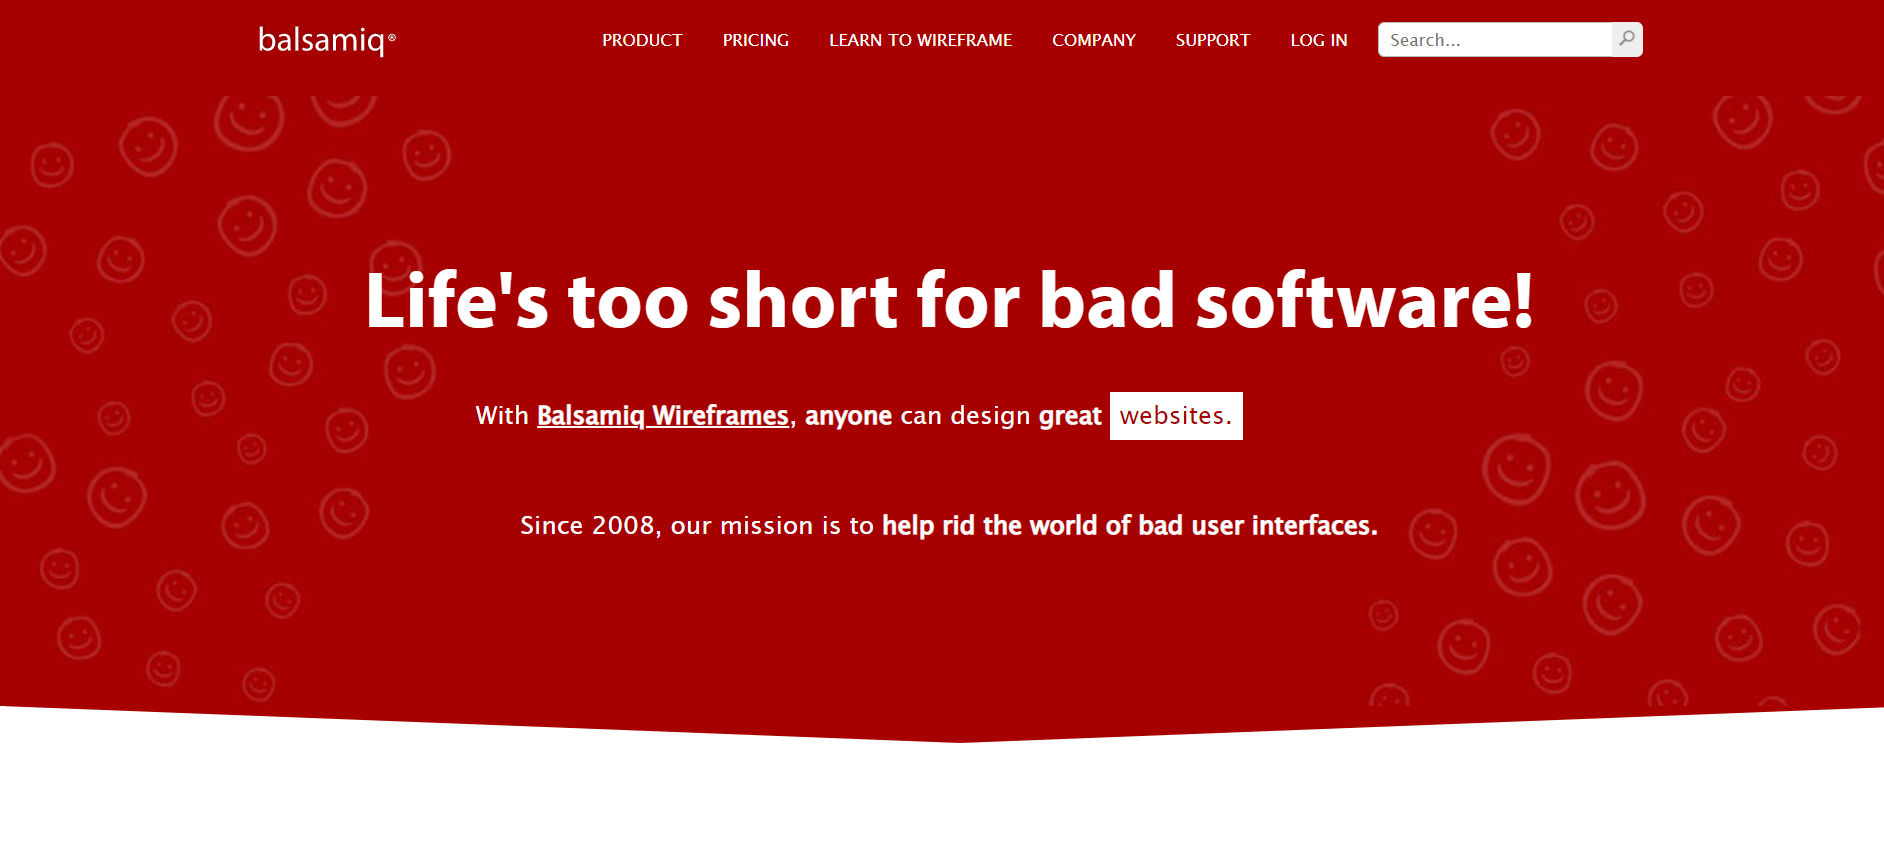
Low-fidelity prototyping/Wireframing tools – To realize more-basic visualizations of potential solutions to problem statements: E.g., Marvel, Balsamiq.
High-fidelity prototyping and user interface (UI) design tools – To realize sophisticated visualizations of design solutions: E.g., Sketch, Figma.
Handoff tools – To send completed design work to developers: E.g., Mockplus iDoc, Zeplin.
Author/copyright holder: Microsoft. Copyright terms and license: Fair Use.
Microsoft Visio is a feature-rich flowcharting tool that has a similar UI to the Microsoft Office suite of apps, which means you probably don’t have to learn to use it.
How to Approach the Right UX Tools
Before reaching for any UX tools, you should consider:
What you do matters more than the tool you choose – UX tools are instrumental to—not guarantees of—your success. As a designer, you can only make impressive and useful solutions if you know what goes where and why. UX experts and recruiters agree that skills come first. So, you should always start with important UX considerations and know what you want to achieve. Then, you select the best tool for the job at hand, even if it’s only pencil and paper. Otherwise, you’ll constrict your vision because the tool can frame your ideas and blind you to users’ needs. Beautiful, trendy-looking products won’t necessarily prove you empathize with users.
UX tools are constantly evolving – New tools and third-party add-ons to existing ones keep appearing on the market. So, it’s vital to stay grounded in the timeless principles of human psychology and your craft, instead of chasing the fleeting shadows of software’s freshest updates. Software will keep changing; users’ brains won’t.
Organizations use different tools –Company practices—including choice of UX tools—vary. Moreover, with time, they’ll switch to the next best thing for them.
Know your Tool like a Pro:
Learn by doing – Practice makes perfect.
Take advantage of the tool-makers’ free tutorials – Intense competition means software brands must battle for customers. That translates to extremely detailed and easy-to-use walkthroughs for you. Should you need further guidance, however, you can turn to external resources and courses.
Overall, your brain is the most precious UX tool you’ll ever have. Professionals are tool-users, but not all tool-users are professionals. What counts is that you can adapt to and learn different UX tools to apply your skillset. From the earliest design phase, you should guide your choice of UX tools with an eye for how your users might encounter your brand, move through subtasks and ultimately reflect on their experience.
Questions About UX Tools? We've Got Answers!
What are the most essential UX tools for beginners?
Beginner UX designers need reliable, intuitive tools that support learning and practical design work. Some essential tools include Figma for interface design and collaboration, Miro for brainstorming and user journey mapping, and Notion for organizing research and project tasks.
Figma offers a user-friendly platform to design interfaces and create prototypes, all in a browser, and its collaborative features make it ideal for teamwork. Miro helps visualize user flows and design thinking processes with its flexible whiteboards. Notion lets designers document insights, plan projects, and manage tasks in one place.
A good place to start is by redesigning a simple app screen in Figma. You can use Miro to map out a user journey for a fictional product. Then, document usability test notes in Notion.
Remember that tools upgrade over time, and the market can see UX tools come and go—rely on your skillset and keep current with which tools help with what area of UX design.
How do I choose the right UX tool for my project?
To choose the right UX tool, match the tool’s capabilities to your project’s stage, goals, and team setup. Focus on tools that streamline your workflow, support collaboration, and align with your design deliverables.
To start, identify your project’s needs: ideation, research, wireframing, prototyping, testing, or handoff. For early-stage brainstorming, it’s a good idea to use a certain set of tools. For interface design and prototyping, others can make good choices. For usability testing, there are other options still. Check if the tool integrates well with others in your stack; this saves time and reduces friction.
It makes good sense to evaluate tools using trial versions. Prioritize cross-functional collaboration—developers and stakeholders should easily interact with your outputs. Rank tools based on learning curve, cost, and scalability.
Why do UX designers use different wireframing, prototyping, and testing tools?
UX designers use different tools for wireframing, prototyping, and testing because each phase demands distinct functions—quick layout sketching, interactive flows, and user feedback collection.
Wireframing toolsfocus on structure, letting designers sketch ideas fast without distractions. Prototyping toolssimulate real interactions and flows to refine usability. Testing toolscapture actual user behavior and insights. Separating tools improves focus and effectiveness at each stage.
It’s best to start wireframing with low-fidelity sketches, then move to mid-fidelity prototypes. Use dedicated testing tools to validate assumptions before you get to the handoff stage. Don’t overload one tool for all stages; it leads to inefficiencies.
How do I collect and analyze user research using UX tools?
To collect and analyze user research with UX tools, use platforms that support data gathering, synthesis, and visualization. Tools like Dovetail, Optimal Workshop, Maze, and Google Forms are great choices to streamline the process from recruitment to insight generation with.
For example, Google Forms helps collect survey data efficiently. Maze supports unmoderated usability tests and organizes quantitative metrics. Optimal Workshop excels in card sorting and tree testing. Dovetail lets you import, tag, and synthesize interview transcripts or testing sessions, highlighting key themes and trends.
Try these actionable insights:
Begin with structured questions and clear objectives.
Record and transcribe interviews for deeper synthesis (always secure users’ consent for recording).
Tag user quotes and behavior patterns to identify insights and pain points.
Explore the vast realm of user research to understand how to make the most of opportunities to fine-tune design solutions for what real users need.
What tools help me run remote usability tests?
To run remote usability tests effectively, use tools that record user interactions, capture feedback, and support real-time or asynchronous testing. Top tools for that include Loop11, Maze, UserTesting, Lookback, and Useberry.
For example, Maze integrates with Figma to test prototypes and gather quantifiable insights. UserTesting offers real-time sessions and detailed analytics. Lookback records user sessions with voice, screen, and face, enabling in-depth analysis. Useberry lets you run unmoderated tests directly on your design prototypes.
Try these actionable insights:
Use unmoderated tests for early feedback and moderated ones for deeper exploration.
Define clear tasks and success metrics before testing.
Combine video feedback with analytics to uncover usability issues.
Enjoy our Master Class How to Get Started with Usability Testing with Cory Lebson: Principal User Experience researcher with 20+ years experience and author of The UX Careers Handbook.
Can I run A/B tests with UX design tools?
Yes, several UX design tools support A/B testing, but they usually integrate with analytics platforms or specialized testing tools like Optimizely, VWO, or Maze.
UX design tools generally don’t tend to run A/B tests themselves, but they do let designers create variant designs for testing. Tools like Maze let you import these prototypes and run A/B tests by measuring which design performs better on real users. Platforms like Optimizely embed variants into live websites and track user behavior statistically.
Try these actionable insights:
Use tools like Maze to test design variants early in your prototyping phase.
For live products, integrate Optimizely to test layout, copy, and flows.
Define clear goals (clicks, signups) and run tests long enough to reach statistical significance.
Discover how A/B testing can help you find which versions of your prototypes and design solutions do better with users.
Which tools let me track user behavior and interactions on a website?
To track user behavior and interactions on a website, you can use tools like Hotjar, FullStory, Mixpanel, and Google Analytics. These platforms offer session recordings, heatmaps, event tracking, and funnel analysis for you to understand user actions.
Hotjar and FullStory provide heatmaps, scroll depth, and session replays to reveal how users navigate and where they drop off. Mixpanel tracks specific user events—like clicks or conversions—and segments users by behavior. Google Analytics delivers quantitative data on traffic sources, bounce rates, and engagement metrics.
Try these actionable insights:
Begin with heatmaps to find out where users click content.
Analyze session replays to expose friction points.
Use Mixpanel or GA to quantify drop-offs and refine your design based on real usage.
Explore the power of analytics, important considerations, and how they help design efforts, as William Hudson, User Experience Strategist and Founder of Syntagm Ltd, discusses:
Copyright
Author: Stewart Cheifet. Appearance time: 0:22 - 0:24. Copyright license and terms: CC / Fair Use. Modified: Yes. Link: https://archive.org/details/CC1218greatestgames
Transcript
Transcript loading ...
What tools make it easier to share designs with developers?
Tools like Figma, Zeplin, and Storybook make sharing designs with developers seamless by providing specs, assets, and code snippets directly from the design files.
Figma leads with built-in developer handoff; inspectable layers, CSS, and layout details are available with just a link. Zeplin bridges the gap by turning designs into specs and syncing with style guides. Storybook helps translate design components into coded UI elements, ideal for design systems.
Try these actionable insights:
Use Figma’s share link with dev mode to give developers instant access.
Sync designs with Zeplin for pixel-perfect implementation.
Pair Storybook with design systems to ensure consistency across code and design.
Find helpful insights about design handoffs and how designers collaborate with developers.
How do I import data from research tools into my design tool
To import data from research tools into your design tool, use integrations, plugins, and structured content like CSVs or tagged insights. Tools like Figma and UXPin support this via third-party apps and APIs.
Research platforms like Dovetail and Maze allow you to export user insights as CSVs or text files. You can then use plugins like “Google Sheets Sync” or “Content Reel” in Figma to inject real data into your mockups. UXPin lets you import JSON data to populate real UI components. These imports bring authenticity to your designs and align them with actual user insights.
Try these actionable insights:
Export tagged insights or CSVs from your research tool.
Use Figma’s Content Reel or Google Sheets Sync plugins to add names, quotes, or test results.
Enjoy our Master Class How to Build Your UX Toolbox with Susan Weinschenk—“The Brain Lady”—Chief Behavioral Scientist and CEO, The Team W, Inc. and author of multiple best-selling books, including 100 Things Every Designer Needs to Know About People—and Guthrie Weinschenk: Behavioral Economist & COO, The Team W, Inc., specializing in behavioral economics, decision-making, and business strategy. He’s also the host of the Human Tech podcast, and author of I Love You, Now Read This Book.
What metrics should I focus on when using UX analytics tools?
Focus on metrics that uncover usability, engagement, and conversion: task success rate, time on task, click-through rates, drop-off points,and error rates. These indicators highlight what works and what hinders your UX.
Task success rate measures if users complete key actions. Time on task and error rate show ease of use. Click-through rates track engagement with UI (user interface) elements. Drop-off analysis pinpoints where users abandon flows. Taken together, these metrics form a holistic view of user experience and can help you prioritize improvements.
Set benchmarks for success and failure.
Use tools like Hotjar or Mixpanel to track behavior and trigger surveys.
Analyze funnels and heatmaps to isolate pain points.
Why? Because design skills make you valuable. In any job. Any industry.
In This Course, You'll
Get excited when you learn the secret to creating products and services people love! If you've ever struggled with conflicting feedback or too many ideas, then this course is for you. Data-Driven Design bridges creativity and logic. You'll use quantitative research to clear the fog and look at people's behavior at scale for everything from apps to business strategies. You’ll learnhow numbers tell powerful human stories, and how timeless human-centered design skills help you interpret them. Data gives you clarity, confidence, and credibility. You'll stop guessing and start making real, evidence-based decisions that lead to more user love, more clarity, and the kind of salary that reflects your value.
Make yourself invaluable as you collect, analyze, and use data to create designs that deliver measurable results. Did you know that data-driven organizations are 23x more likely to hook new customers, 6x more likely to retain them, and 19x as likely to be profitable? In this course, you'll get in-demand skills that make you an asset in any role that involves decision-making or problem-solving. Data-driven insights—like conversion rates, A/B test results, or satisfaction metrics—make it easier to get buy-in from decision-makers and show the Return on Investment (ROI) of smart, human-centered decisions. As AI becomes standard for processing data, your ability to frame the right problems, interpret results through a human lens, and translate insights into action is what makes you irreplaceable and turns AI into your new superpower.
Gain confidence and credibility with hands-on methods and a step-by-step approach to basic statistics. It's easier than you think, even if you don't have experience with design or data. You'll learn to screen participants, write good questions for meaningful surveys, and avoid survey bias. Fast-track your success with 10+ ready-to-use templates, like our How to Choose a Statistical Test guide. Optional real-world projects, including user surveys and early-design testing, allow you to use your new skills immediately and walk away with standout case studies for your portfolio!
It's Easy to Fast-Track Your Career with the World's Best Experts
Master complex skills effortlessly with proven best practices and toolkits directly from the world's top design experts. Meet your expert for this course:
William Hudson: User Experience Strategist and Founder of Syntagm.
Get an Industry-Recognized IxDF Course Certificate
Increase your credibility, salary potential and job opportunities by showing credible evidence of your skills.
IxDF Course Certificates set the industry gold standard. Add them to your LinkedIn profile, resumé, and job applications.
Be in distinguished company, alongside industry leaders who train their teams with the IxDF and trust IxDF Course Certificates.
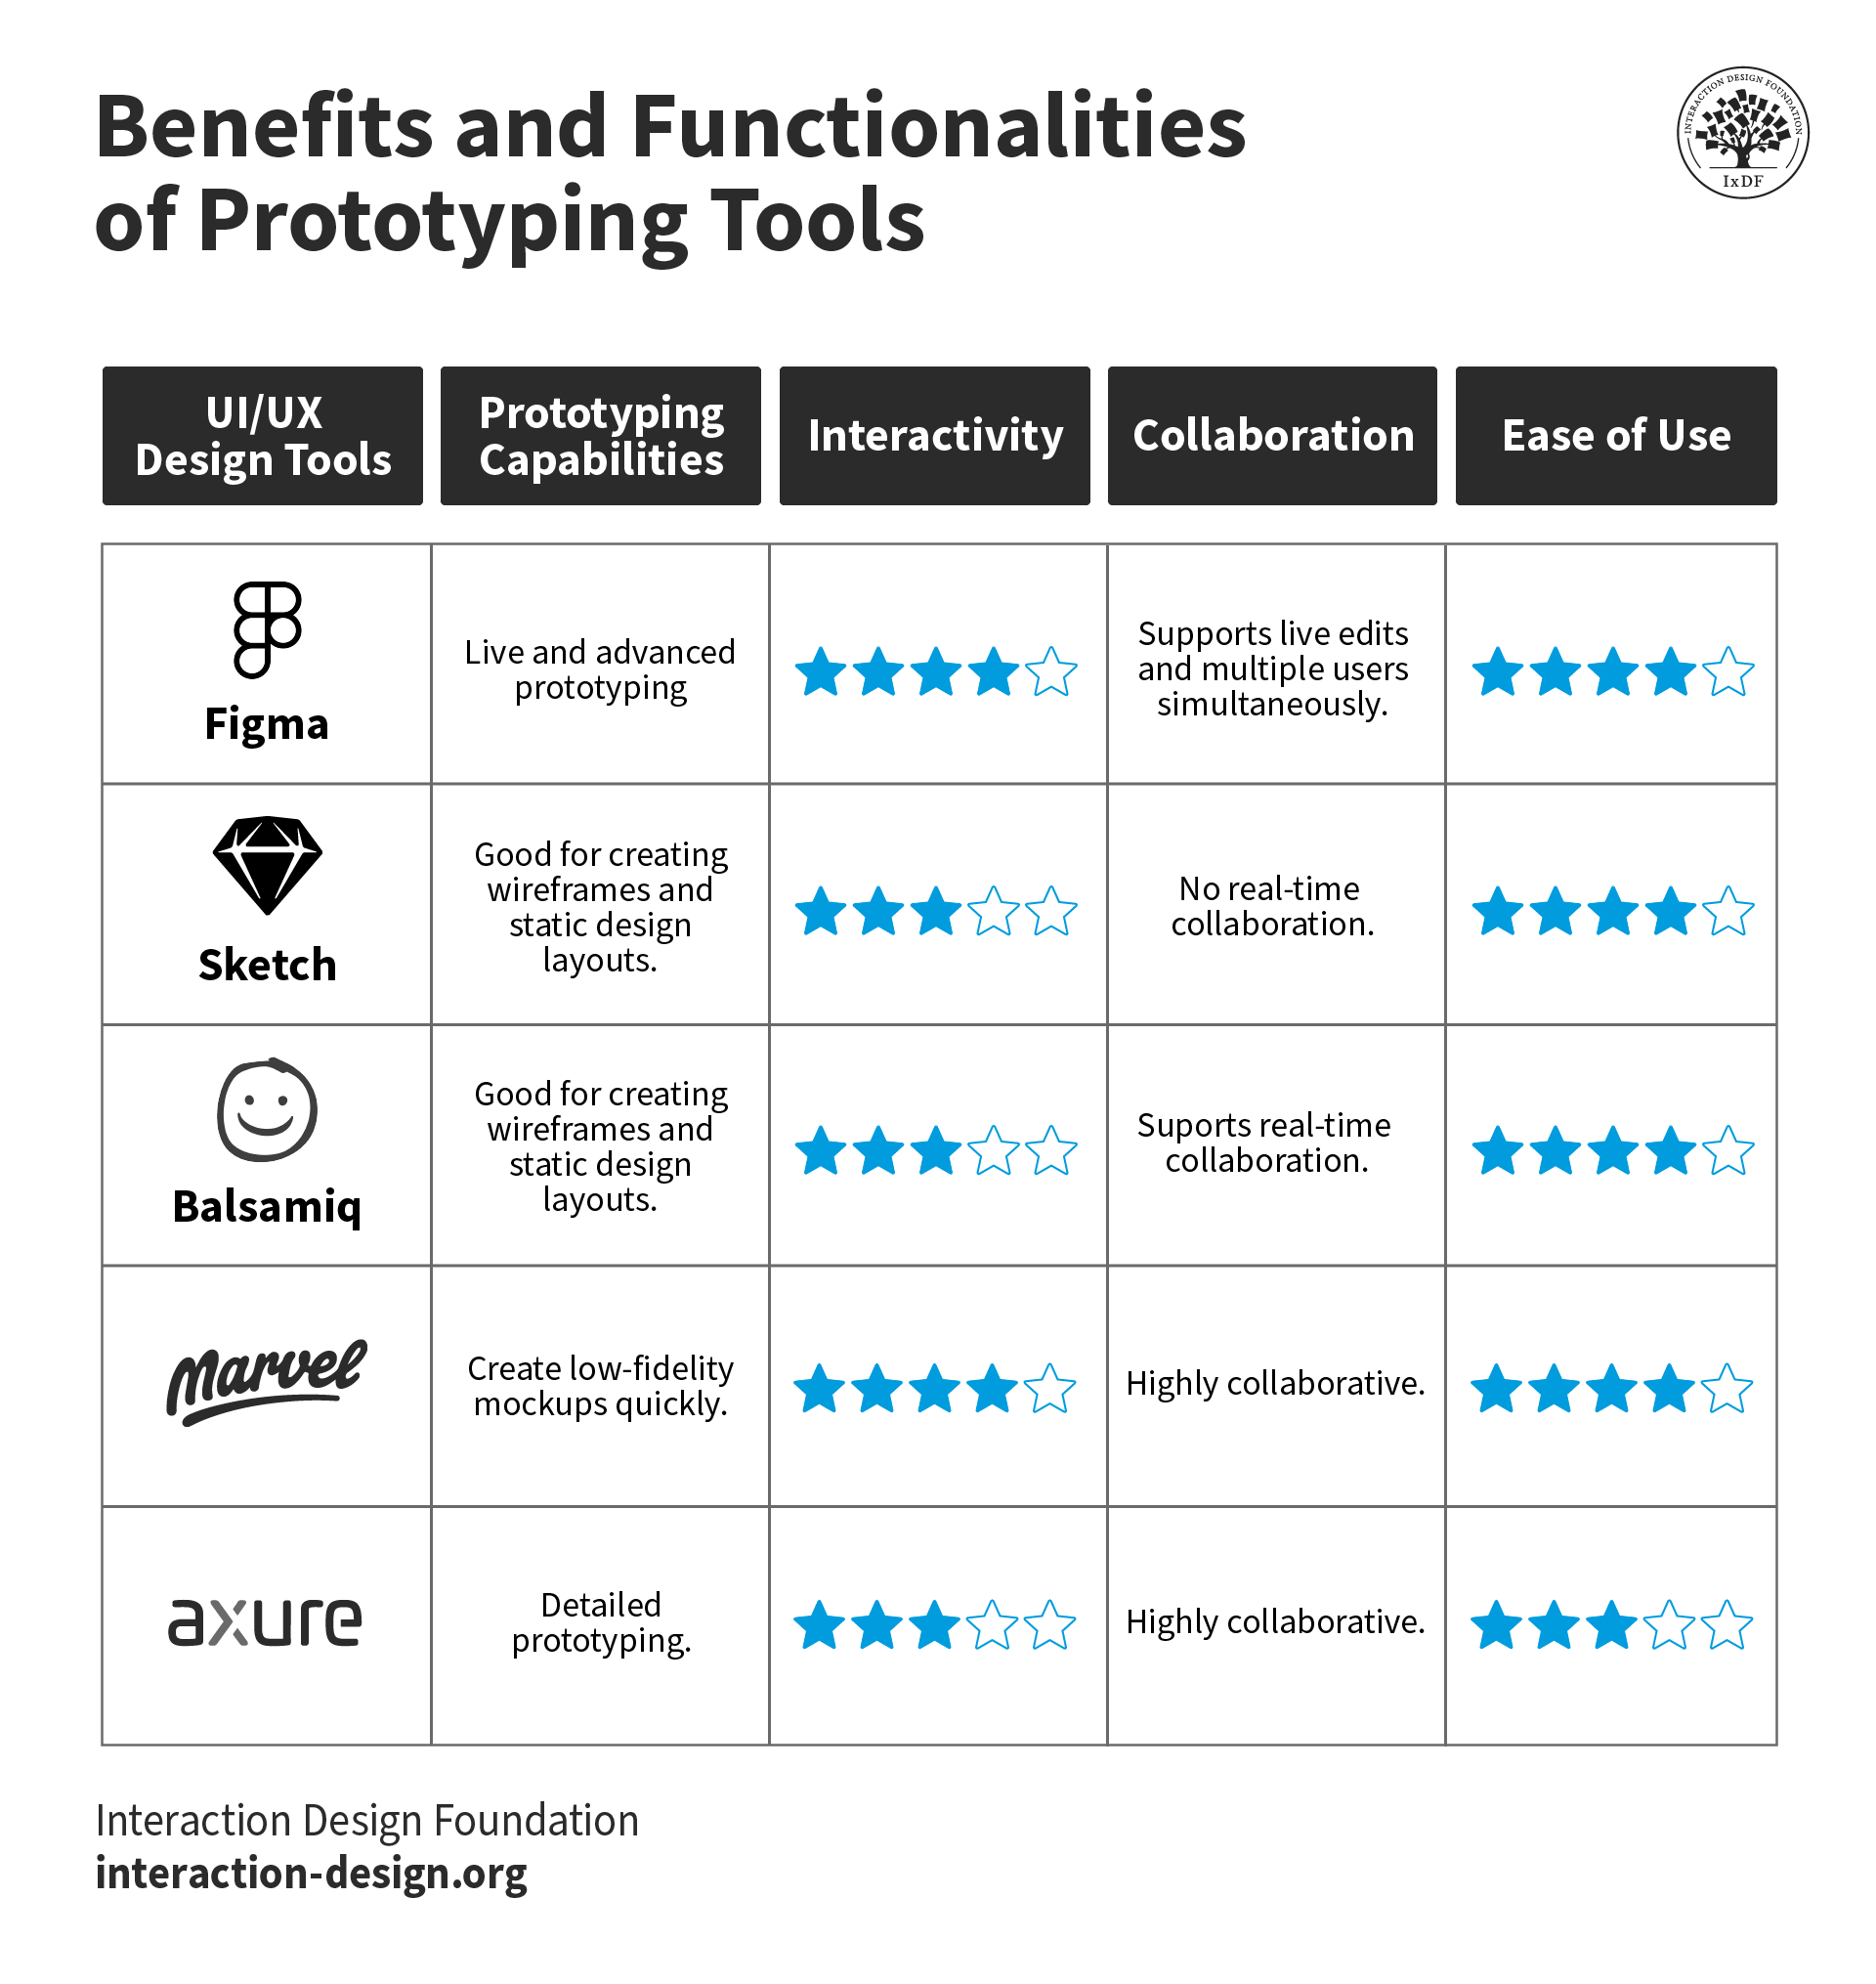
Top UX and UI Design Tools for 2026: A Comprehensive Guide
UI/UX design tools, also called user interface and user experience design tools, are specialized software applications that help designers create, modify, and explore user interfaces and user experiences. But they’re more than just software: They’re like bridges in a sense, or a way for you, dear de
Prototyping is the bridge that carries you, as a designer, between a concept and the first attempts to get it into some concrete form in UX design (User Experience). It allows you to move ideas from your mind into hands-on experiences for others to see, test, and critique, and for you to iterate on
In design—and anywhere else that innovation is involved—words can often paint a picture far more vividly than strokes on a canvas ever could, and that’s true in UX design (user experience design), where inspiration often comes from straightforward phrases. These brief quotes are way more than just w
When you think about user experience design (UX design) and what the ingredients for users to enjoy great experiences are—and so, what you need to think about presenting to them in innovative and delightful ways they can hit the ground running with—does it seem a little overwhelming sometimes? Does
UX/UI Tools vs. Design Principles: What Are Hiring Managers Eager to See in Your Portfolio?
Without your tool of choice, are you still a designer? UX/UI design tools are the conduits through which designers craft innovative, problem-solving solutions. Mastery of a design tool helps you work faster and build better designs. New features unlock new possibilities and allow you to push the bou
How to Get Meaningful Design Feedback from Your Clients
Meaningful design feedback is essential to the collaborative and iterative design process, and it’s equally important for UX/UI designers, graphic designers, product managers and most creative professionals. However, getting design feedback from clients can be one of the most painful aspects of the
Social shares
683
Published
Read Article
Top UX and UI Design Tools for 2026: A Comprehensive Guide
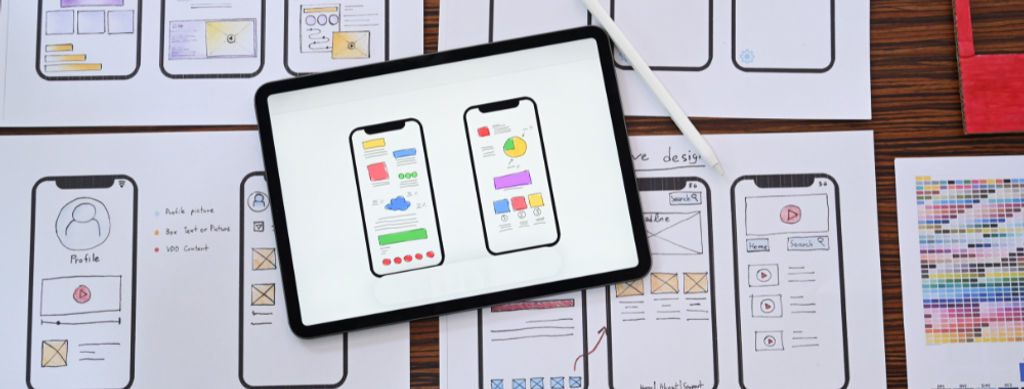
UI/UX design tools, also called user interface and user experience design tools, are specialized software applications that help designers create, modify, and explore user interfaces and user experiences. But they’re more than just software: They’re like bridges in a sense, or a way for you, dear designer, to turn abstract concepts into solid design solutions that your brand’s users will be delighted with and keep coming back to. To help you out choices-wise, we’ve put together a little “best of” list that features some top UX and UI design tools for 2026, so be sure to keep on reading.
Why Do You Need UX and UI Design Tools?
Sure enough, these tools are vital parts of a designer’s toolkit. With that said, it’s important to first be clear that what’s inside the designer’s head, as in, your head, is the most essential tool of all. You need a strong grasp of theoretical aspects, like color theory and design principles, to effectively use tools that help you turn abstract ideas into concrete designs. This can be through sketching, wireframing, prototyping, and usability testing. That’s how you edge your way towards user-friendly designs that can really exceed user expectations and delight your target audience in seamless experiences that bring your brand (and design solution) to life.
Another massive bonus (or essential benefit) of UI and UX design and prototyping tools is how they help streamline your design process. That’s because they bring design teams and other project stakeholders closer for collaboration and feedback. What’s more, design tools help you do user research so you can understand user needs, behaviors, and preferences and then leverage the insights in the name of user-centered design. From there, you can create intuitive, engaging, and effective designs that can wow target users and secure their loyalty to your brand.
Watch UX Consultant and Strategist, William Hudson explain important points about user research and why you need it.
Transcript
Transcript loading ...
We won’t spend long on the history of UI and UX design tools, as they've evolved a great deal since the early days of web design, back when designers had to rely heavily on basic graphic design software. The modern era demands tools for designing complex interfaces and interactions, which is worlds apart from the static mockups of web pages from yesteryear. The tools mirror not just the rapid technological advancements, but great shifts in user behavior, too.
Think of a favorite app for a moment and consider what life was like before it, and then reflect on how people’s expectations may have built up around that app so that it’s become the norm as a design solution for them. It could be for listening to music, ordering food, or whatever the “problem” a user may need a design solution for. Tools come into play somewhere along the way as designers and design teams work out the best solutions to make.
What Types of UI and UX Design Tools Are There?
Before we start on our list, it’s important to keep in mind some sound advice from Author and Global UX Executive, Professor Daniel Rosenberg:
Transcript
Transcript loading ...
You’ve got various tools that cater to different stages of the design process, ranging from wireframing to prototyping. Each type of tool brings unique benefits and addresses distinct challenges.
Wireframing tools are the blueprint machines of the design process. You use them to make a skeletal layout of a web page or app to illustrate the page structure, content arrangement, and intended functionalities. And so, you set the groundwork for more detailed design work later. Wireframes are crucial tools to have in the early design stages, because they help clarify the project’s scope and make it easier to get ideas across to (and from) stakeholders.
Wireframing software helps speed you through the initial design phase through simple drag-and-drop elements and make wireframes, which help you visualize the layout. You can explore different layout options that much more easily and make rapid iterations to them. What’s more, wireframing tools help you establish the basic structure of your design before things get more detailed, a point that also translates to the advantage that (since they look so malleable and are relatively simple and quick things) colleagues and users can be honest about suggesting changes. That’s as opposed to feeling reluctant to criticize high-fidelity prototypes, which, being more intricate and detailed, take more time and sweat to alter.
Really the only palpable drawback of wireframes is that, because they don’t have the visual design appeal of a fully designed interface, it can be harder for stakeholders who aren’t familiar with the design process to get a picture of what the final product is going to look like.
Figma, Balsamiq, and Sketch are popular choices for wireframing thanks to their simplicity and efficiency.
2. Prototyping Tools
Once you’ve got the basic structure of a design put into place, you can bring prototyping tools into the picture. They’re tools that let you create interactive mockups and showcase how the final product is going to work. This includes everything from button interactions and animations to transitions and user flow.
Prototypes can give a real feel for the user experience, and the tools for them can help you a great deal when you do usability testing because they give people you give them to a hands-on experience of the design before any coding begins. So, they enable you, through your test users, to find and resolve usability issues early in the process and so lessen the risk of costly changes needing to happen later in development. Another neat plus is how prototypes help you communicate design ideas; as in, get these ideas more effectively across to stakeholders because they’ll have something set in front of them to see in more detail. And so, it will secure you better feedback from them and alignment all around.
To be sure, high-fidelity prototypes can be time-consuming to make. And then, test users might feel bad about being honest with you if there’s something wrong with a prototype they’ve got in front of them since they’ll tend to think you sank a great deal of time and effort into it and may not want to upset you. Aside from that, there’s also the point that some prototyping tools may be limited in how they simulate complex interactions. And it may lead to there being discrepancies between the prototype and the final product.
Figma and Axure RP have got strong reputations for what they can do for designers prototyping-wise. And they’ll provide you with a wide array of interactive elements and transition effects, so you can get into full swing with making prototypes that get results.
3. User Research Tools
If there’s one thing that’s certain in design, there’s a fair likelihood that it’ll be the research side of it. Without adequate research, designers can end up creating something they believe will be popular, effective, and helpful, only to have it tank in the marketplace because it misses the mark, slips, and tumbles into obscurity. To not trip over your assumptions, you’re going to need to do user research and get into your users’ shoes, and, to a certain degree, their heads. That’s so you can get an accurate picture of who they are and what their contexts are like if you’re to build up the empathy you’ll need to design the best solution for them.
User research tools are critical instruments here, and they’re things you use to get insights about users’ behaviors, needs, and motivations. With tools that include heatmaps and card sorting, you can apply these insightfully to help you understand the user journey, find pain points, and craft a user experience that’s truly intuitive and satisfying for the end user.
The biggest plus about using user research tools is that they’ll provide you and your design team with data-driven insights that can inform every stage of the design process. That’s how you can create user-centric products while keeping valuable aspects about your brand’s users clearly in focus. These tools let you test hypotheses, validate designs, and understand user needs and preferences in a way that’s detailed, which helps you understand your users and their realities.
To a massive degree, how effective user research tools are is largely down to the sample size and representativeness of the user group that’s involved in the research. You’ll need to appreciate the intricacies of UX research and how it takes time and resources to set up studies and analyze data, too, and how sometimes the data can be challenging or even overwhelming to interpret if don't have the right expertise.
SurveyMonkey and Google Forms are simple, accessible tools you can use to conduct surveys, and Lookback is a solid example for user interviews. UserTesting provides audio and video feedback from users who are interacting with your designs. UX research tools like Hotjar offer you heatmaps, session recordings, and other tools for understanding user behavior on a website. Meanwhile, for early design, products such as Optimal Workshop provide card sorting, tree sorting, and first-click testing; so, there’s a good deal of options to pick from.
What Are 3 Key Factors to Choose UI and UX Design Tools?
1. Ease of Use
The first thing you’ll likely want to get a clear view about your potential picks of UX or UI design software is that all-important ease of use factor. An intuitive interface with straightforward functionalities can let you get down to matters and empower you to efficiently create, iterate, and test your ideas. Pick a tool with a steep learning curve, though, and it might slow you down as you get used to its various features and intricacies. Think carefully about how quickly you can adapt to a new tool, and whether it has a supportive community or good resources for troubleshooting and learning.
2. Features
Tool features are often what people focus on most, the “What’s it got?” factor. But the features that a design tool offers you should be in line with what you need for your project: You know, when you need a drill, reach for a drill, not a hammer sort of thing. And that’s why it’s vital when you know exactly what your needs are to match them with the right tool's features. Tools can “specialize” well in specific areas or phases of the design process, running the range across wireframing, prototyping, or what have you.
There’s a chance (or slightly more than just a chance) that one of your designer-ly tasks will find you working on high-fidelity interactive prototypes. To do this, you’ll likely want a tool with advanced prototyping capabilities, such as Figma or Axure RP. Meanwhile, for other tasks, tools like Balsamiq or Sketch can be excellent choices for creating wireframes or static design layouts.
3. Cost
Some design tools are free, while others come with a cost; that’s either as a one-time purchase or a recurring subscription fee. Perhaps counterintuitive at first glance, the most expensive tool might not necessarily be ideal for what you need to do. Many affordable (as in, cheaper) or even free tools do offer powerful functionalities and have just the right features for your needs. So, look at cost, but remember your particular requirements in the moment for each thing you need to do in a project. You might just surprise yourself!
What Are Tips and Best Practices to Use UI and UX Design Tools?
Check out templates and UI kits because many UI and UX design tools have pre-built templates and UI kits in them. You’ll find they can help fast-track your design process as they have pre-designed components that you can customize to fit your project's needs with nice precision.
Use grids and layouts, as grids are a massive help for keeping things ordered. They’re also great for maintaining alignment and consistency, providing a structured layout that guides element placement so a balanced and organized design can emerge with less effort.
Master shortcuts because keyboard shortcuts can speed up your design process by a good amount. So, get familiar with the shortcuts of the tool you pick as it will help you perform actions quickly and efficiently.
Sync with a design system as this helps keep everyone on the same page if you work on a large project or as part of a team. Plus, it sets down a shared language and set of components for all of you to enjoy a great amount of consistency across designs that you work on, too.
Prototype early and often, because prototyping isn’t just important, it’s something you should keep doing. It's best to start prototyping early on and then to keep on iterating on your prototypes from what you find out from feedback and usability testing as you go on. And what you find may surprise you so much that you’ll be glad you course-corrected or fine-tuned things to maximum effect.
Stay organized because your design files and layers need that sense of order. It’ll make it so much easier to navigate your design, make changes, and collaborate with other people who are involved in your project, so nobody ends up asking what’s where or furrows their brow in confusion from trying to make sense of a morass of sprawl.
Keep on learning and don’t worry, it goes with the territory, because UI and UX design tools keep evolving as new features and improvements get added regularly. So, it’s more than a little wise for you, dear designer, to stay updated with the latest advancements and learn how to apply useful ones so you’ve got a sharper extra edge in your craft.
Prioritize accessibility because accessible design is a massive issue to keep in mind, and it’s the law in many jurisdictions, in fact. So, do take advantage of many design tool features that help you test and improve accessibility with big plusses like adequate color contrasts, legible fonts, and clear navigation.
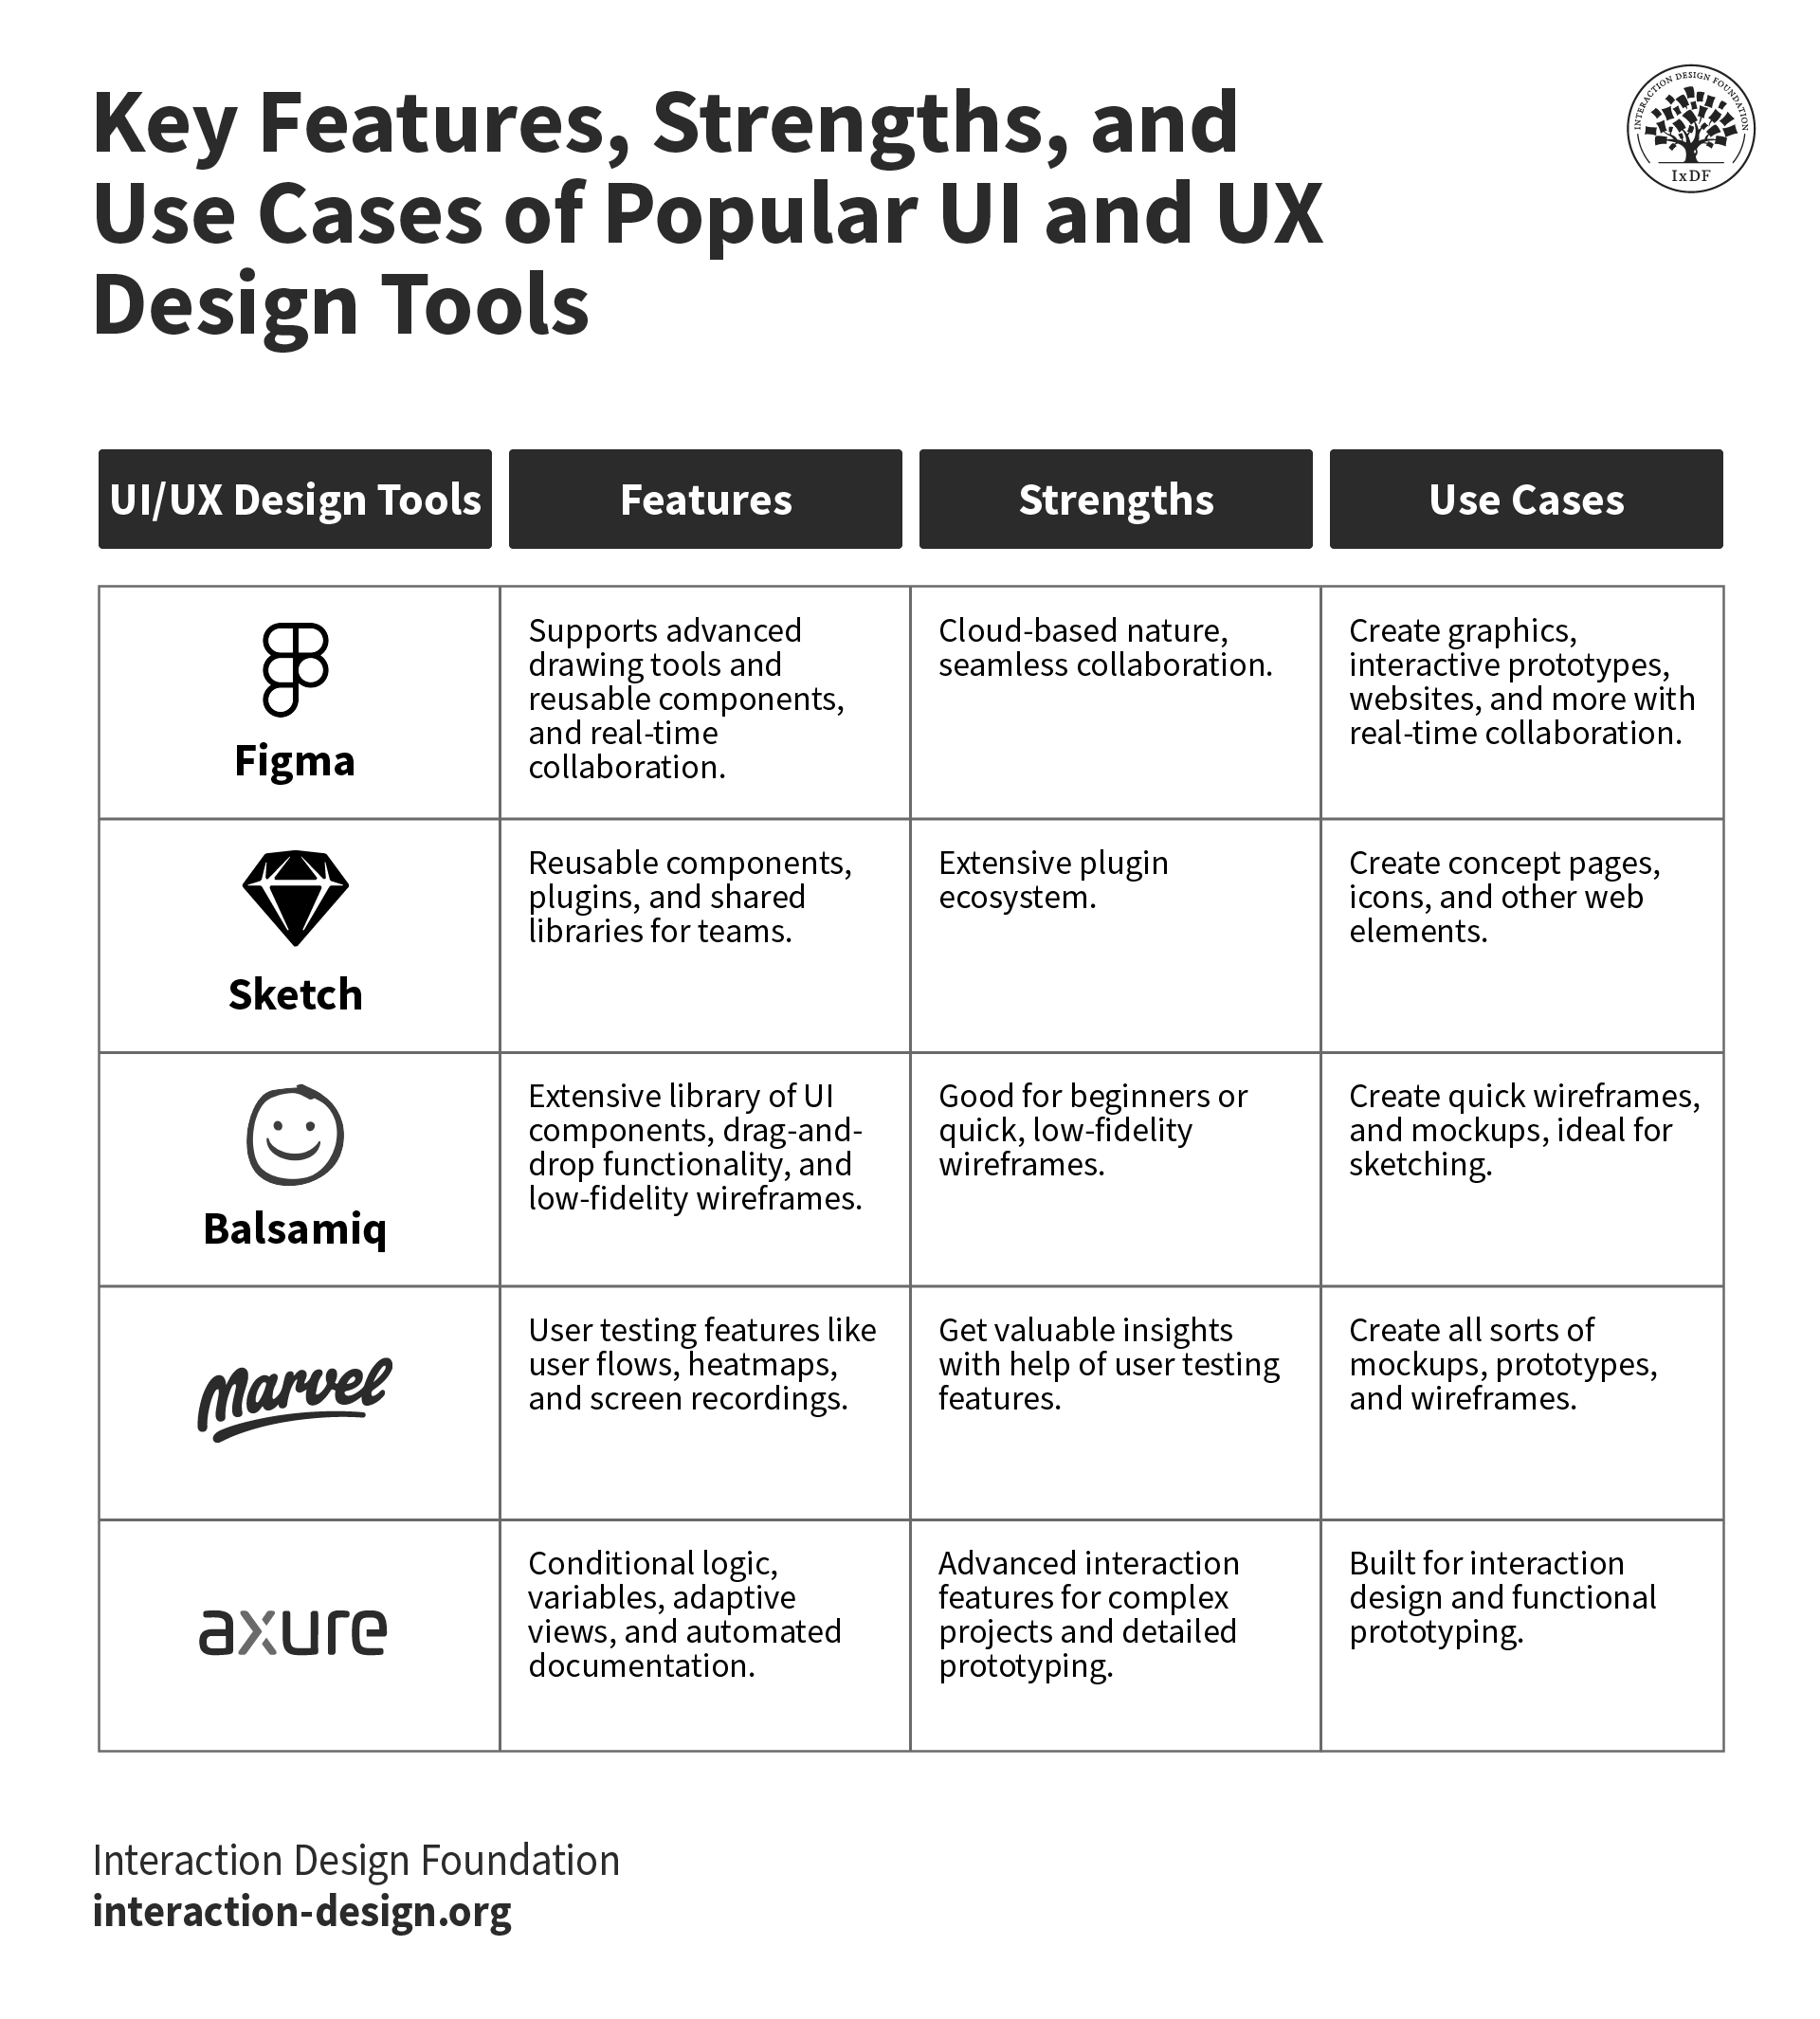
Figma (a popular cloud-based design tool that’s known for its collaborative features) lets multiple designers work on a project at the same time, part of what makes it a go-to pick for design teams.
A neat and ultra-helpful point about Figma is how it supports advanced drawing tools, components, and real-time seamless collaboration. These are things you’ll be glad for when you’re using it and when you look back. Other juicy plusses are how you can create interactive wireframes within the application, its cloud-based nature is something that makes it accessible from any system that’s got a browser. What's more, Figma promotes design asset management and provides design systems that put consistency forward across designs.
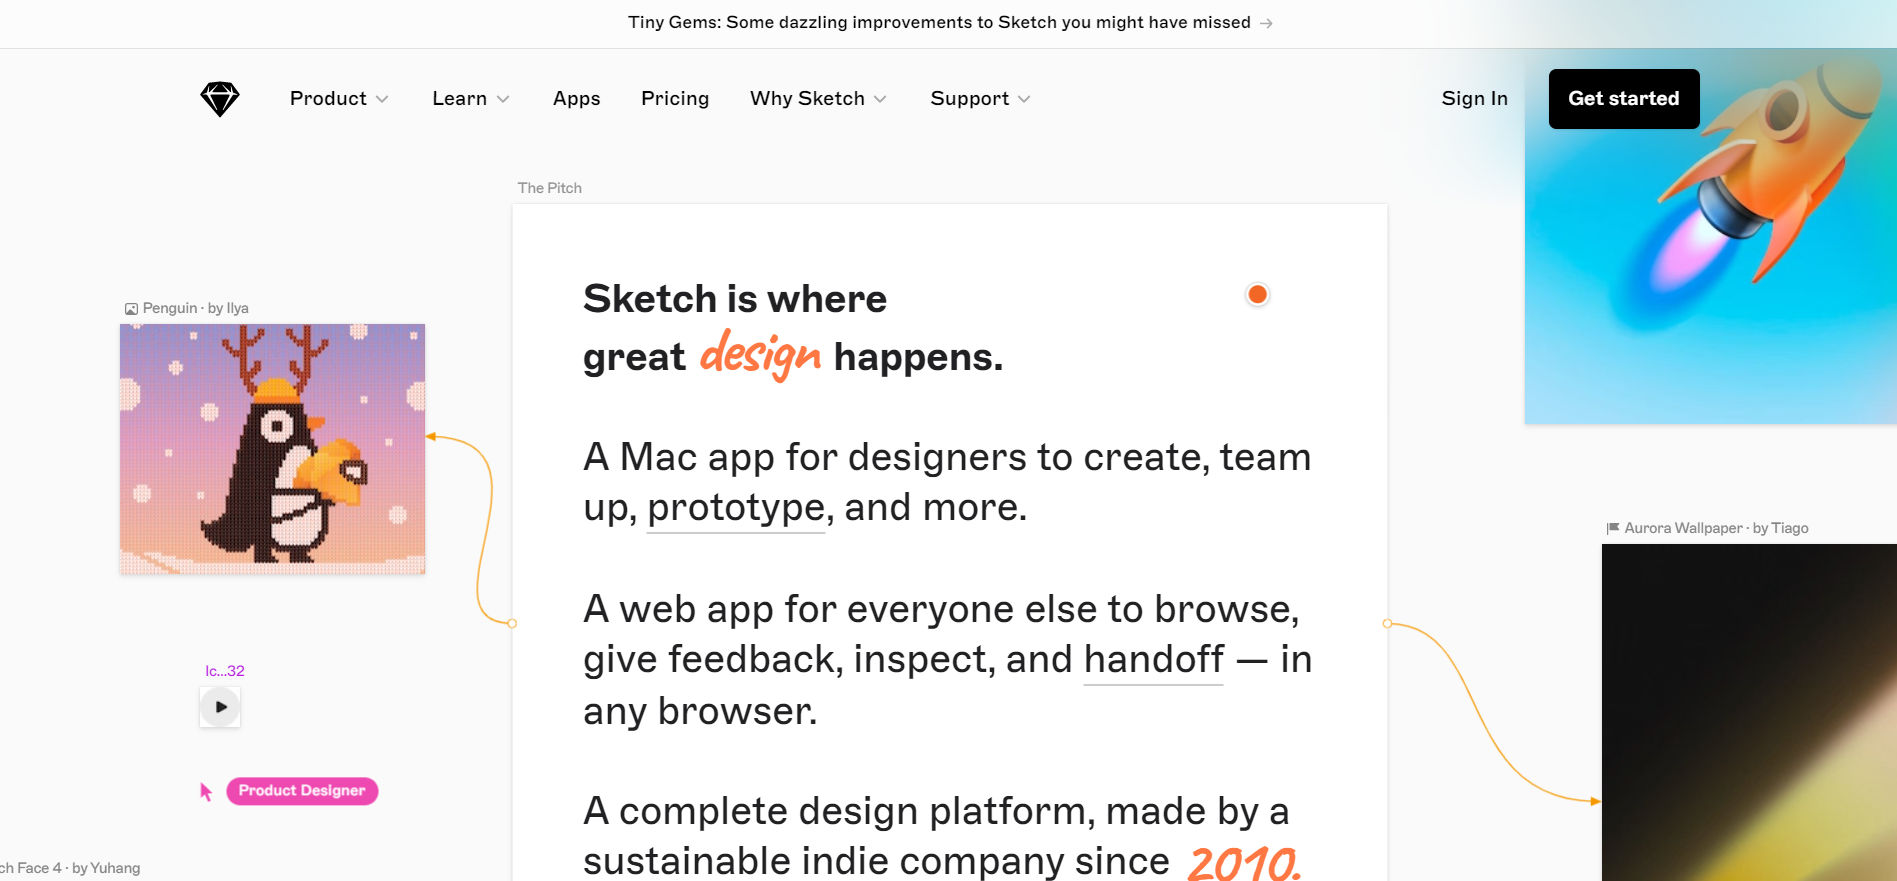
Sketch is a vector graphics editor tool for macOS (and another popular pic) and one thing it’s known for is how it stands for simplicity and efficiency. It’s no surprise, then, that it’s so widely used in designing interfaces, icons, and websites.
Sketch has got some neat features that make it a hot choice on the go-to list, especially as it provides you with symbols and styles for reusable components, plugins for extended functionality. And an extensive plugin ecosystem offers you a highly customizable design experience and shared libraries for that (yes, ultra-important) team collaboration factor that you’ll tend to need on projects.
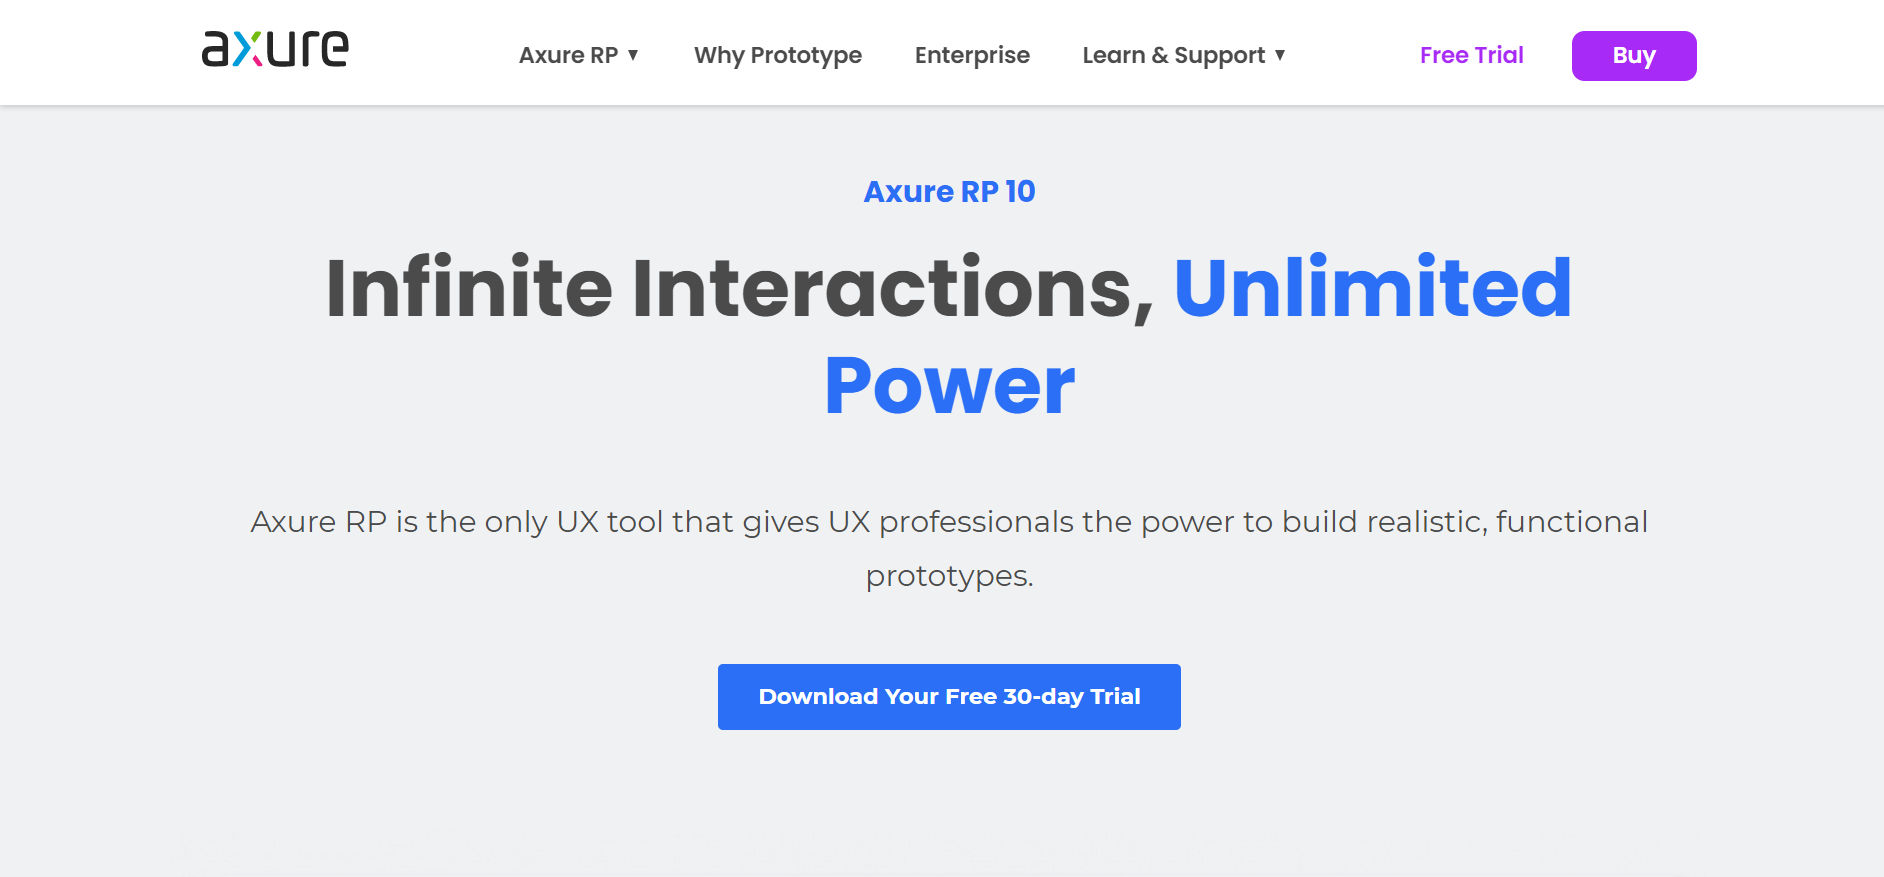
Axure RP is a nice and solid, comprehensive tool if you’re in the market for wireframing, prototyping, and documenting design projects (and you probably will be). Its detailed specifications, documentation tools, and dynamic, conditional interactions are some of the key strengths Axure is known for.
here’s a great deal to like about Axure RP, as it allows designers to create highly interactive and dynamic prototypes with conditional logic, variables, and adaptive views. And, on top of that, it supports collaborative editing and automated specification documentation, too. Its advanced interaction features make it ideal if you just happen to be involved in complex projects and are doing things like detailed prototyping.
Next up, and not that this is in any particular order, we’ve got a popular wireframing tool that helps designers and product managers create mockups nice and fast. Plus it's designed to mimic the speed and simplicity you’d find when sketching on a whiteboard.
Balsamiq’s got a lot to offer features-wise, too, not least since it provides an extensive library of UI components and icons, drag-and-drop functionality, and sketch-style wireframes for a low-fidelity look. It’s a marvelous pick for those lower-fidelity prototypes. In any case, the simplicity factor, which is a big one when you’re involved in early-stage concept development, makes Balsamiq a solid place to start for beginners and a welcome go-to whenever you need to get a lo-fi wireframe or prototype done.
How About an In-Depth Review of a Top UX and UI Design Tool?
Sketch
Why Did We Choose Sketch?
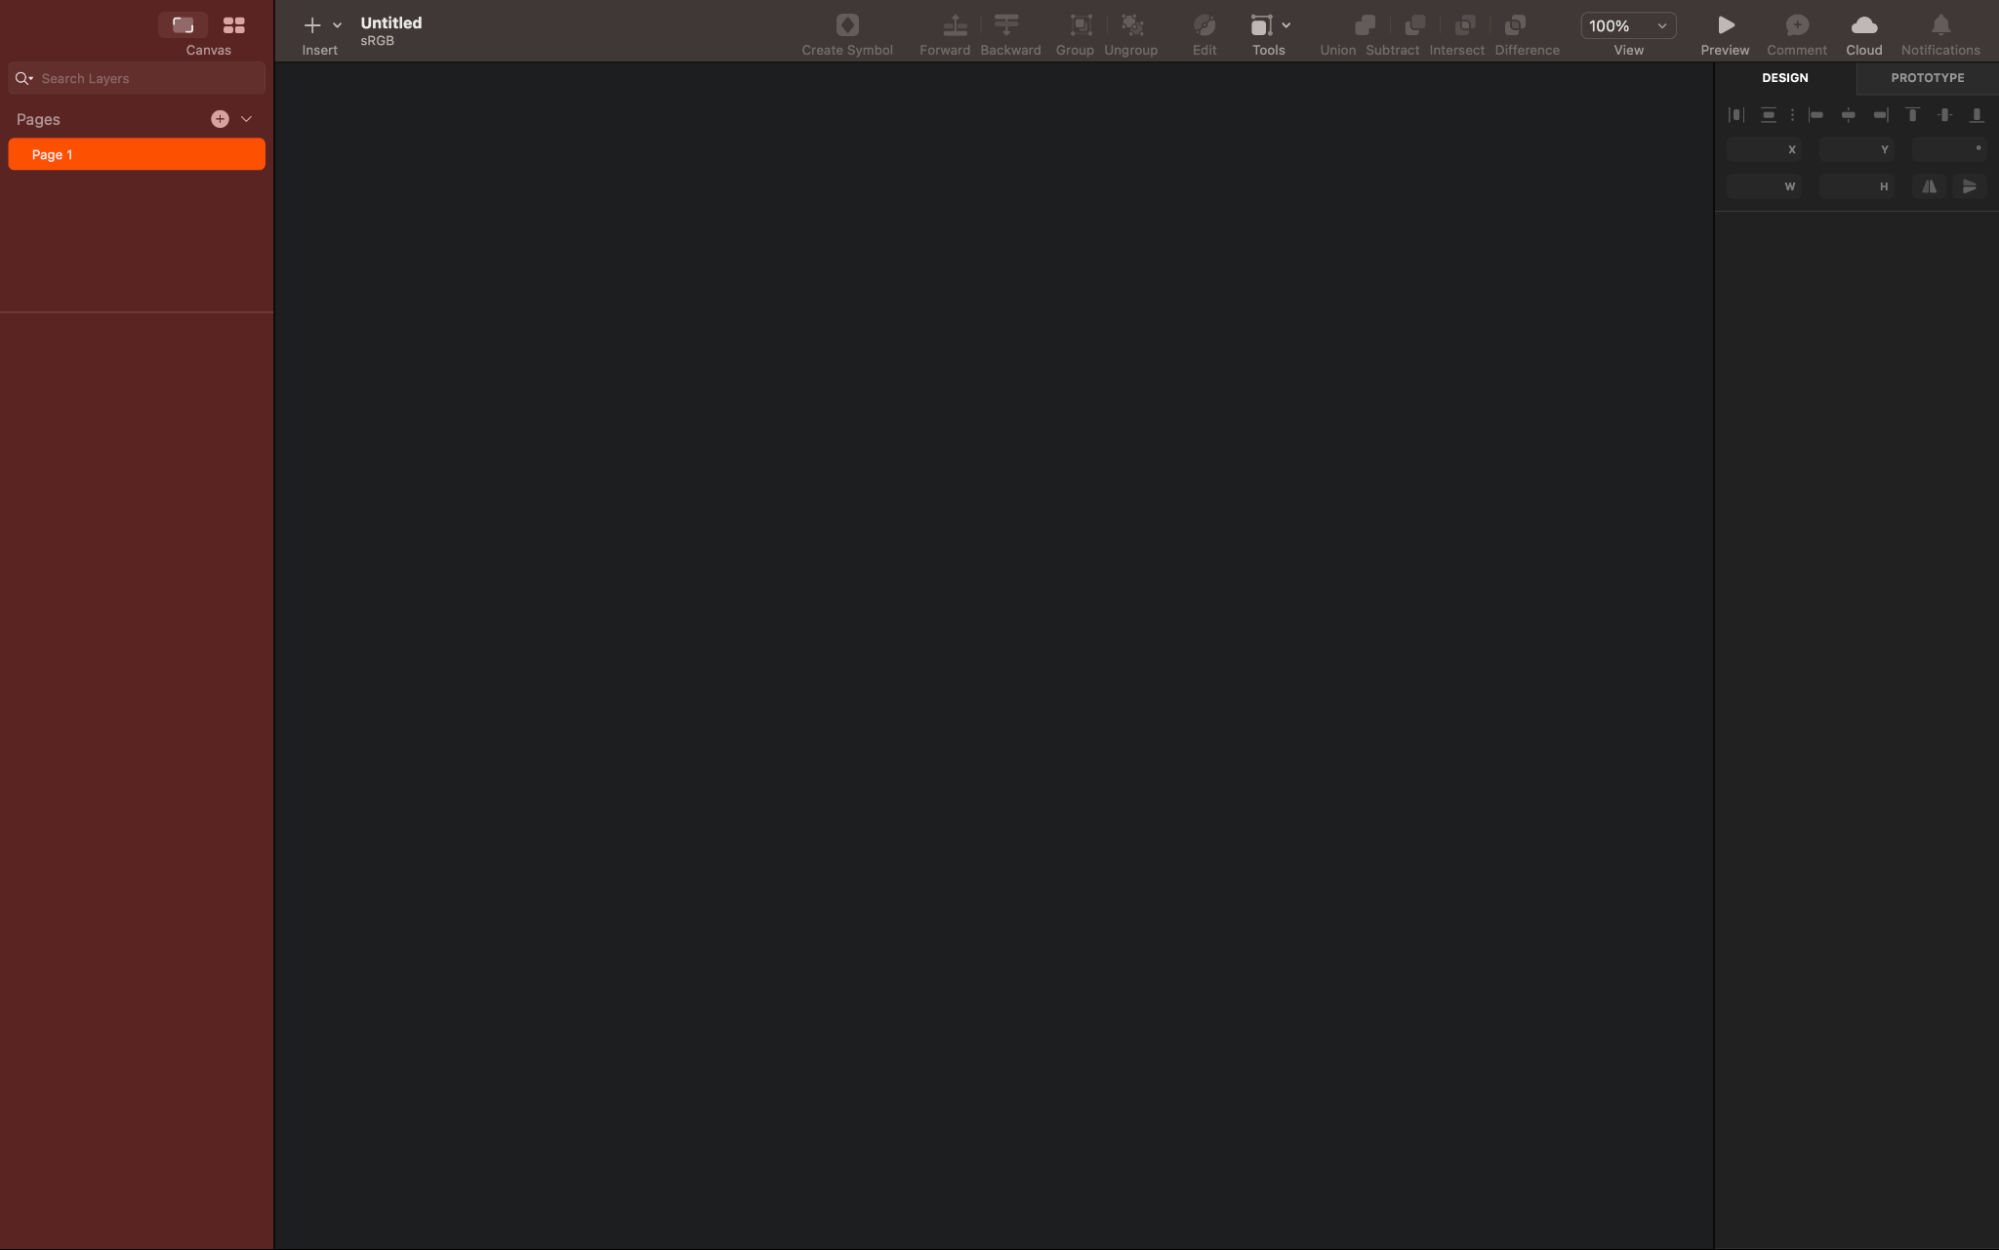
We’ll pop the hood on one of our picks now and get into it in far more detail; and we’ll take Sketch as an example. One of the reasons we like Sketch is that its lightweight, with a disk space of only 45MB. And it’s a point that makes it both a fast and responsive tool to use and a nifty asset to have your hands on when you’re in the design chair.
It’s a native Mac application, and it offers you an intuitive user interface with a familiar (and customizable) toolbar, navigator, and inspector. And it’s something that makes it a nifty and accessible tool for beginners and experienced designers alike.
How Does Sketch Work?
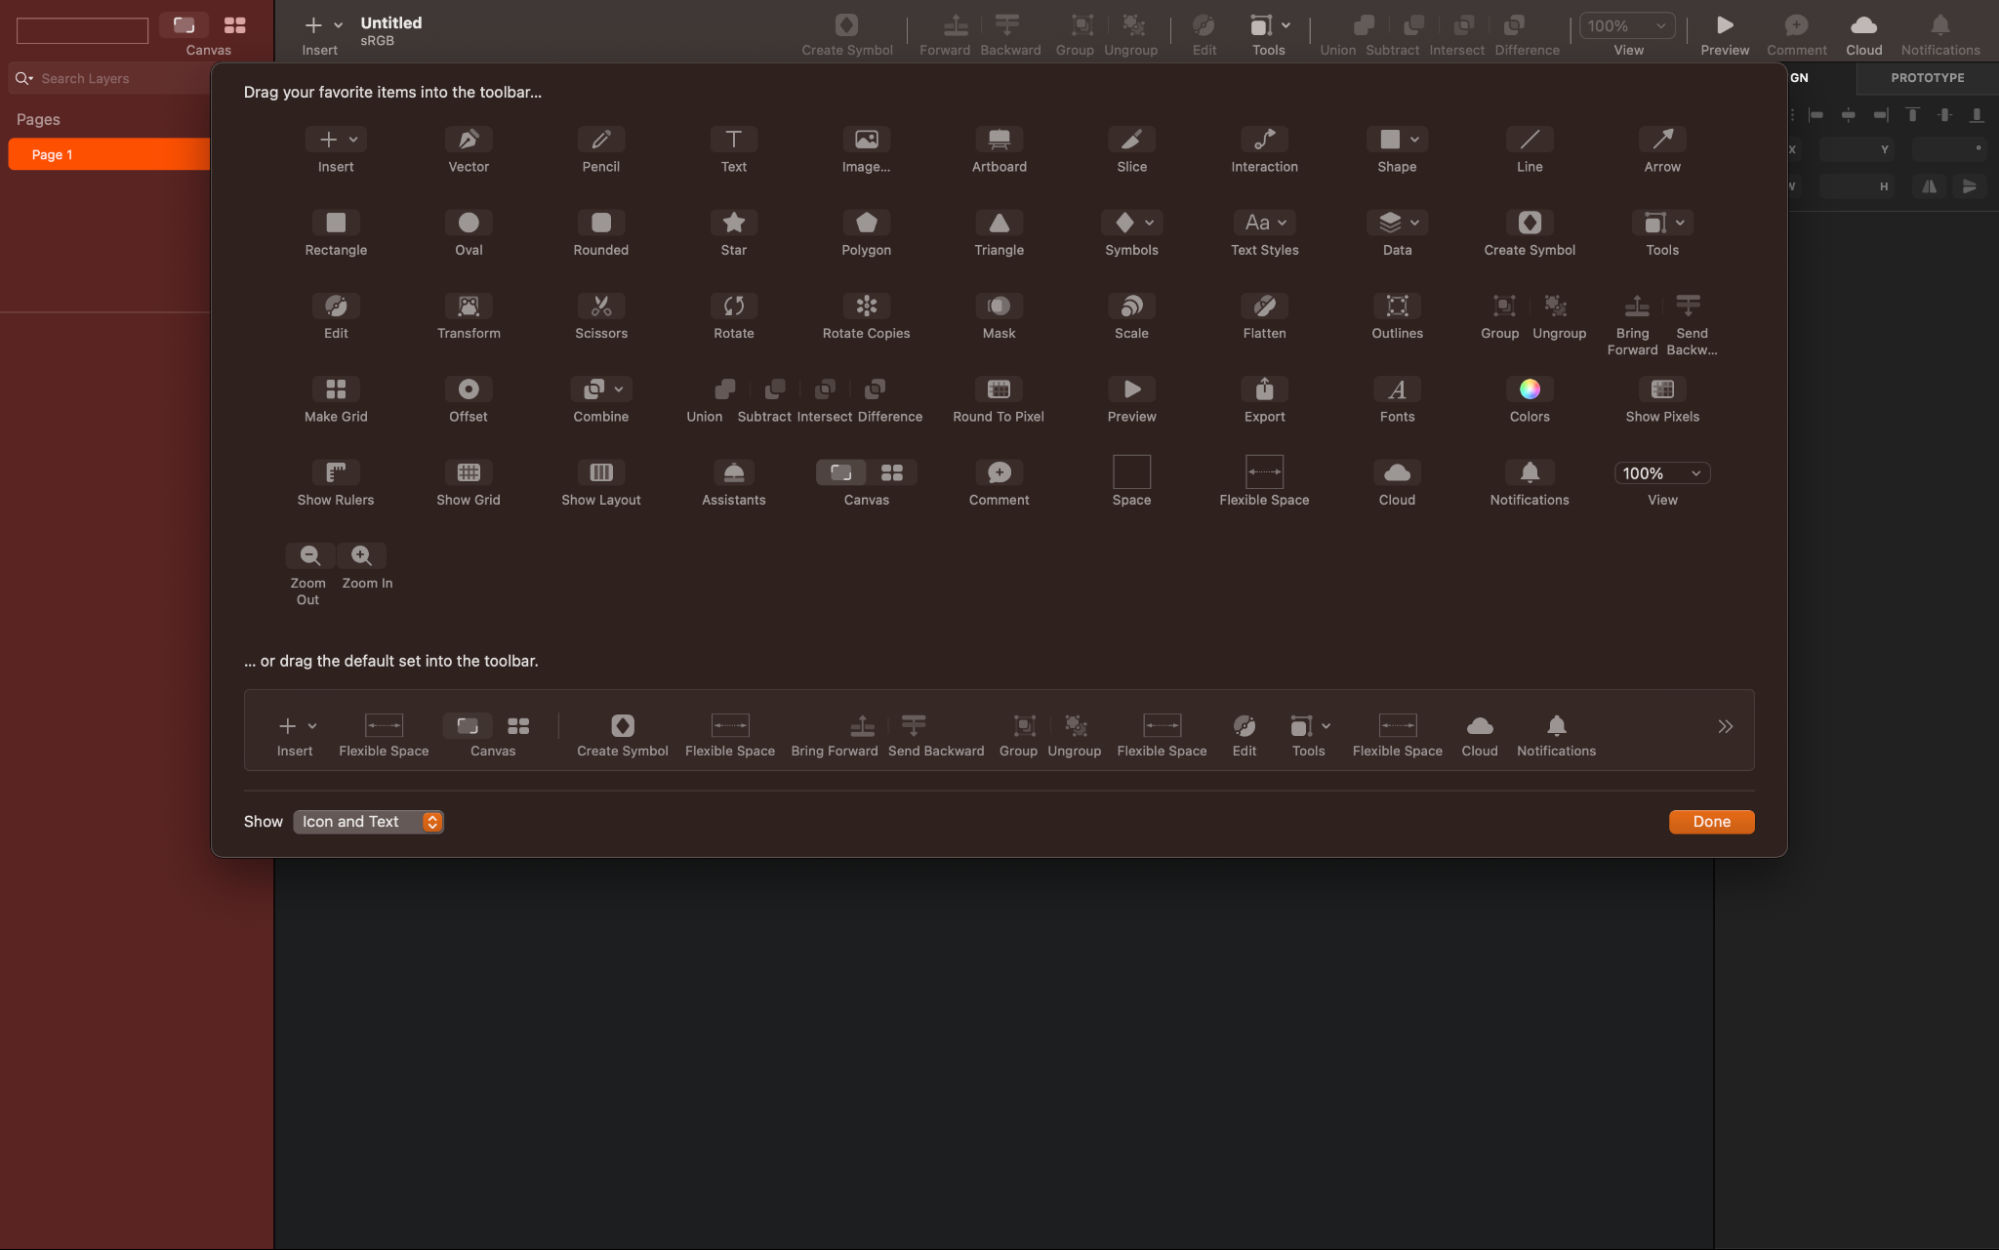
How to Customize Your Toolbar
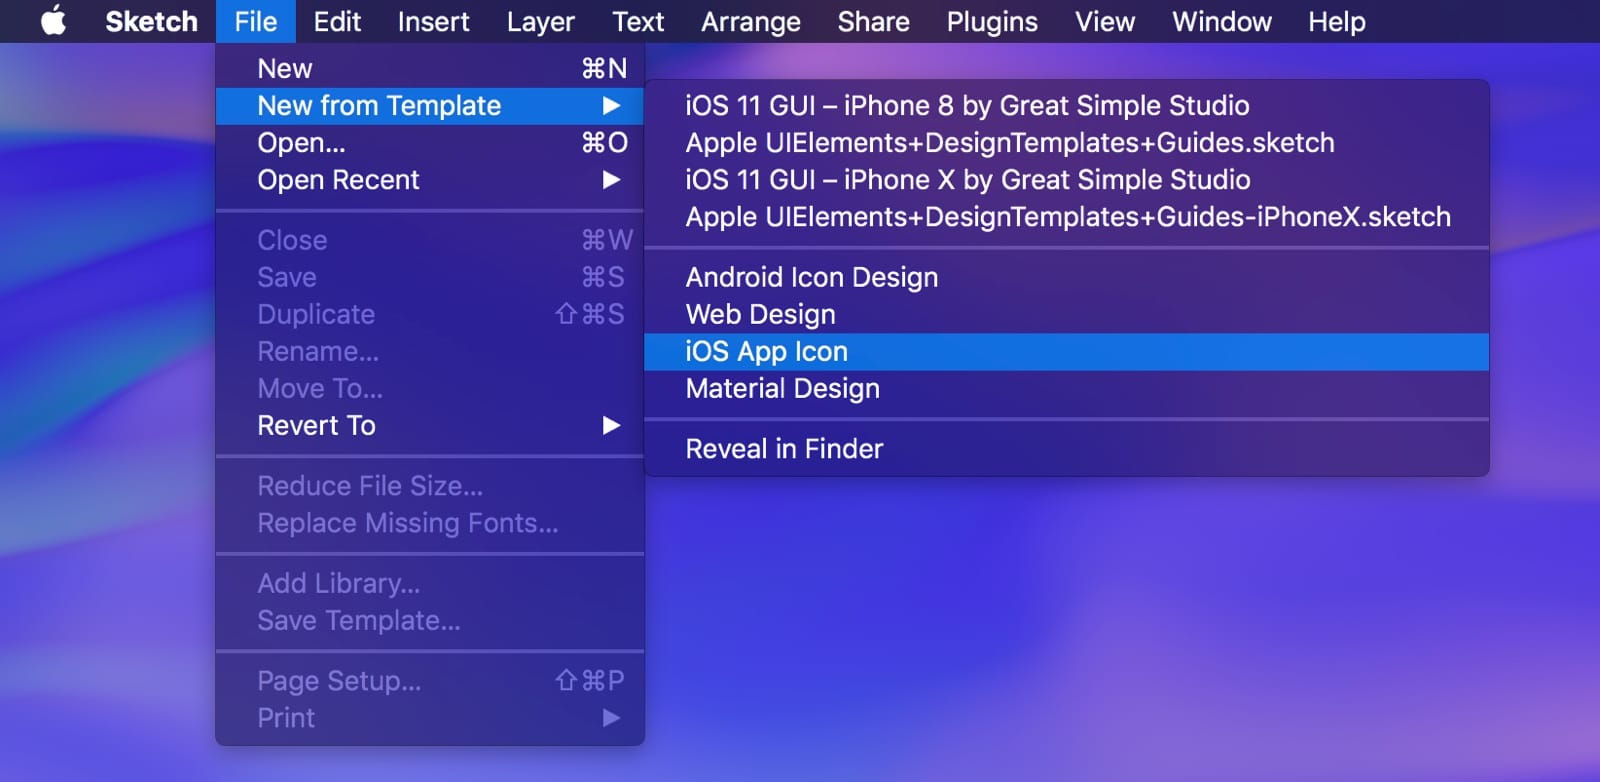
To start, you need to personalize your toolbar so it suits your workflow. To do this, right-click on the toolbar and select the tools you use most frequently. Tools like Symbols, Scissors, Outlines, and Round to Pixel can be especially handy. Check out the screenshot below to see an example of a customized toolbar.
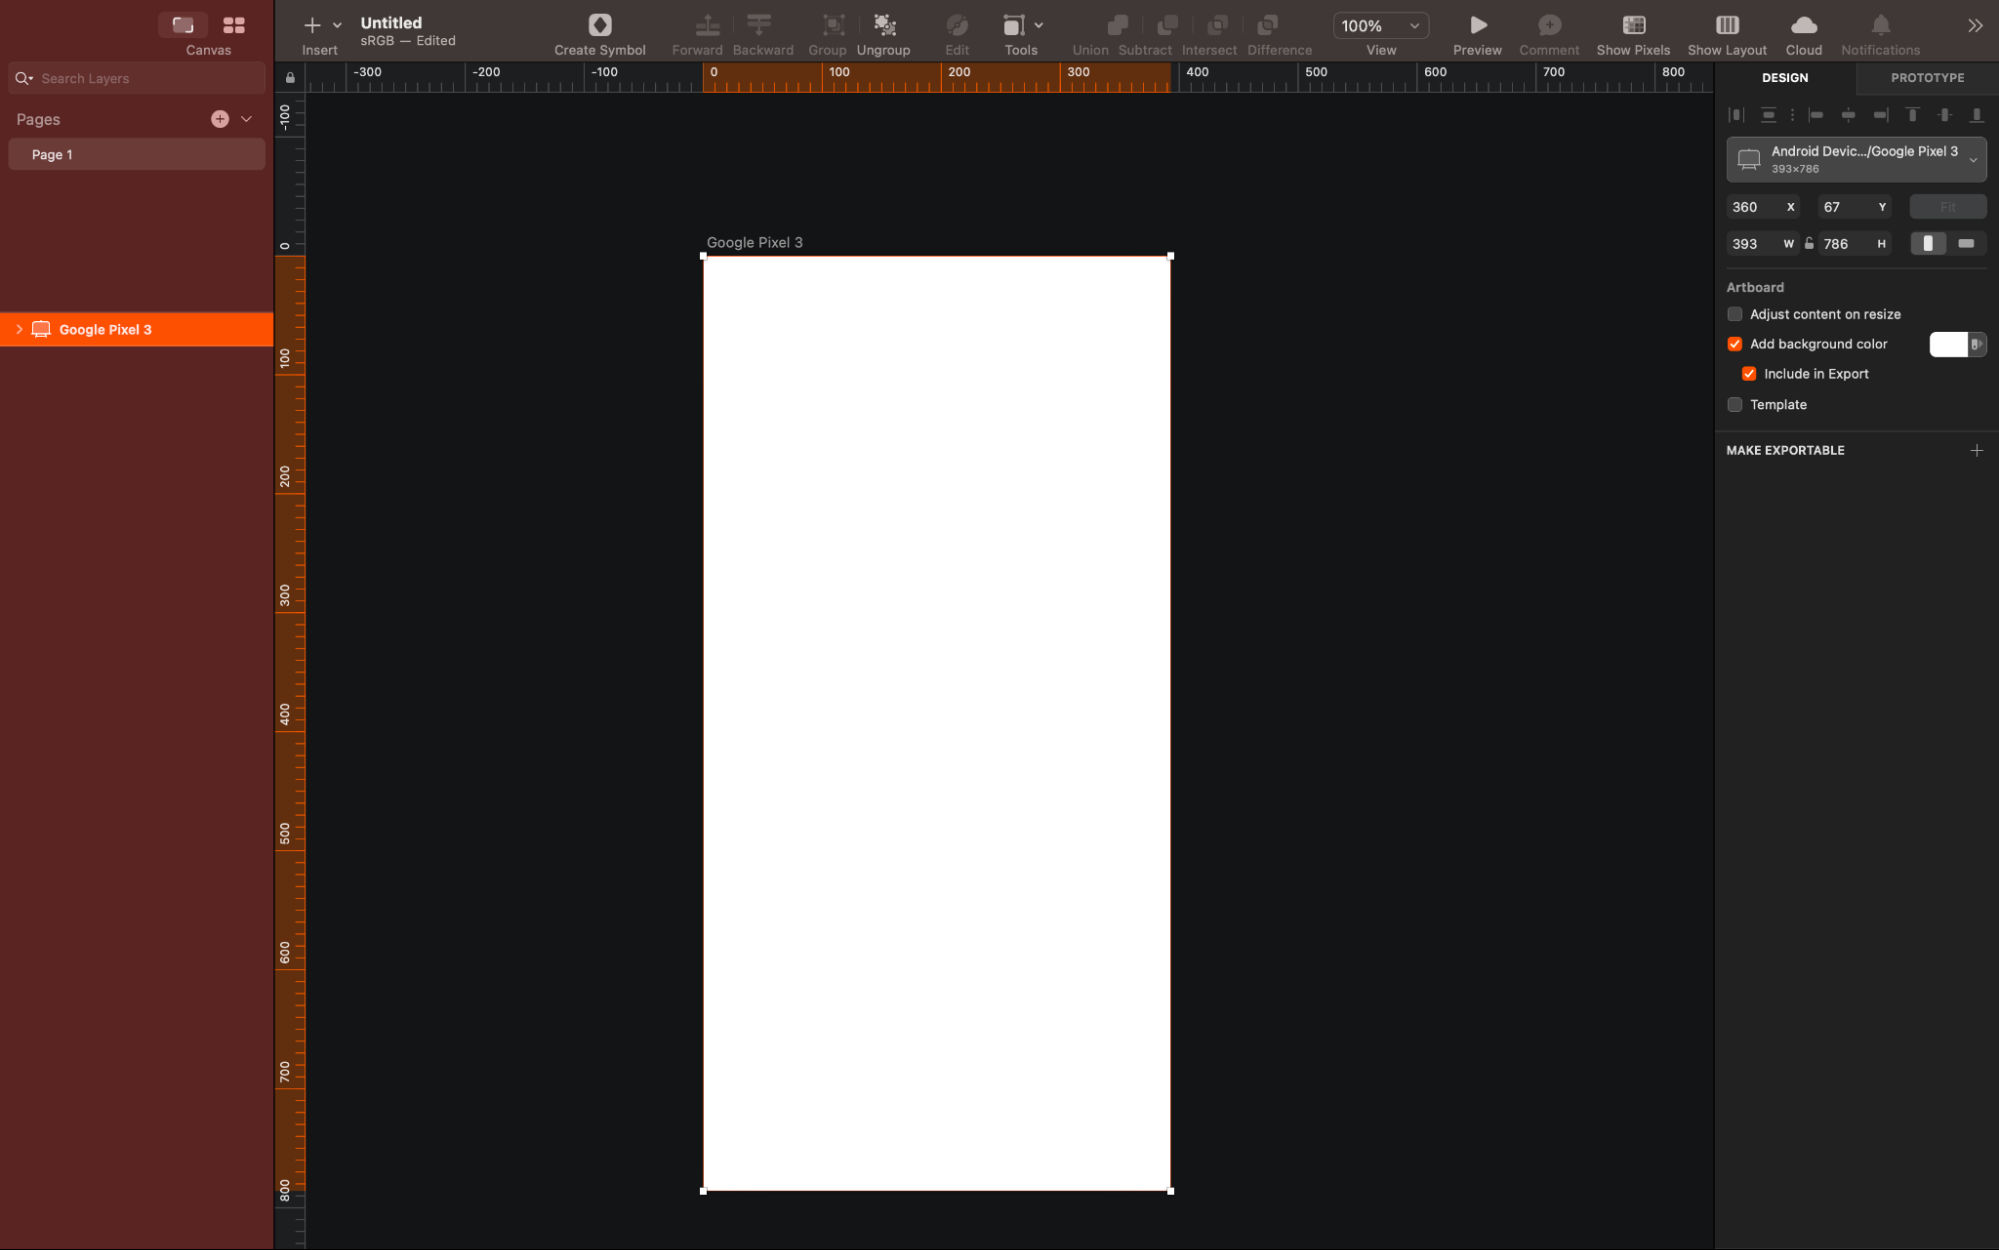
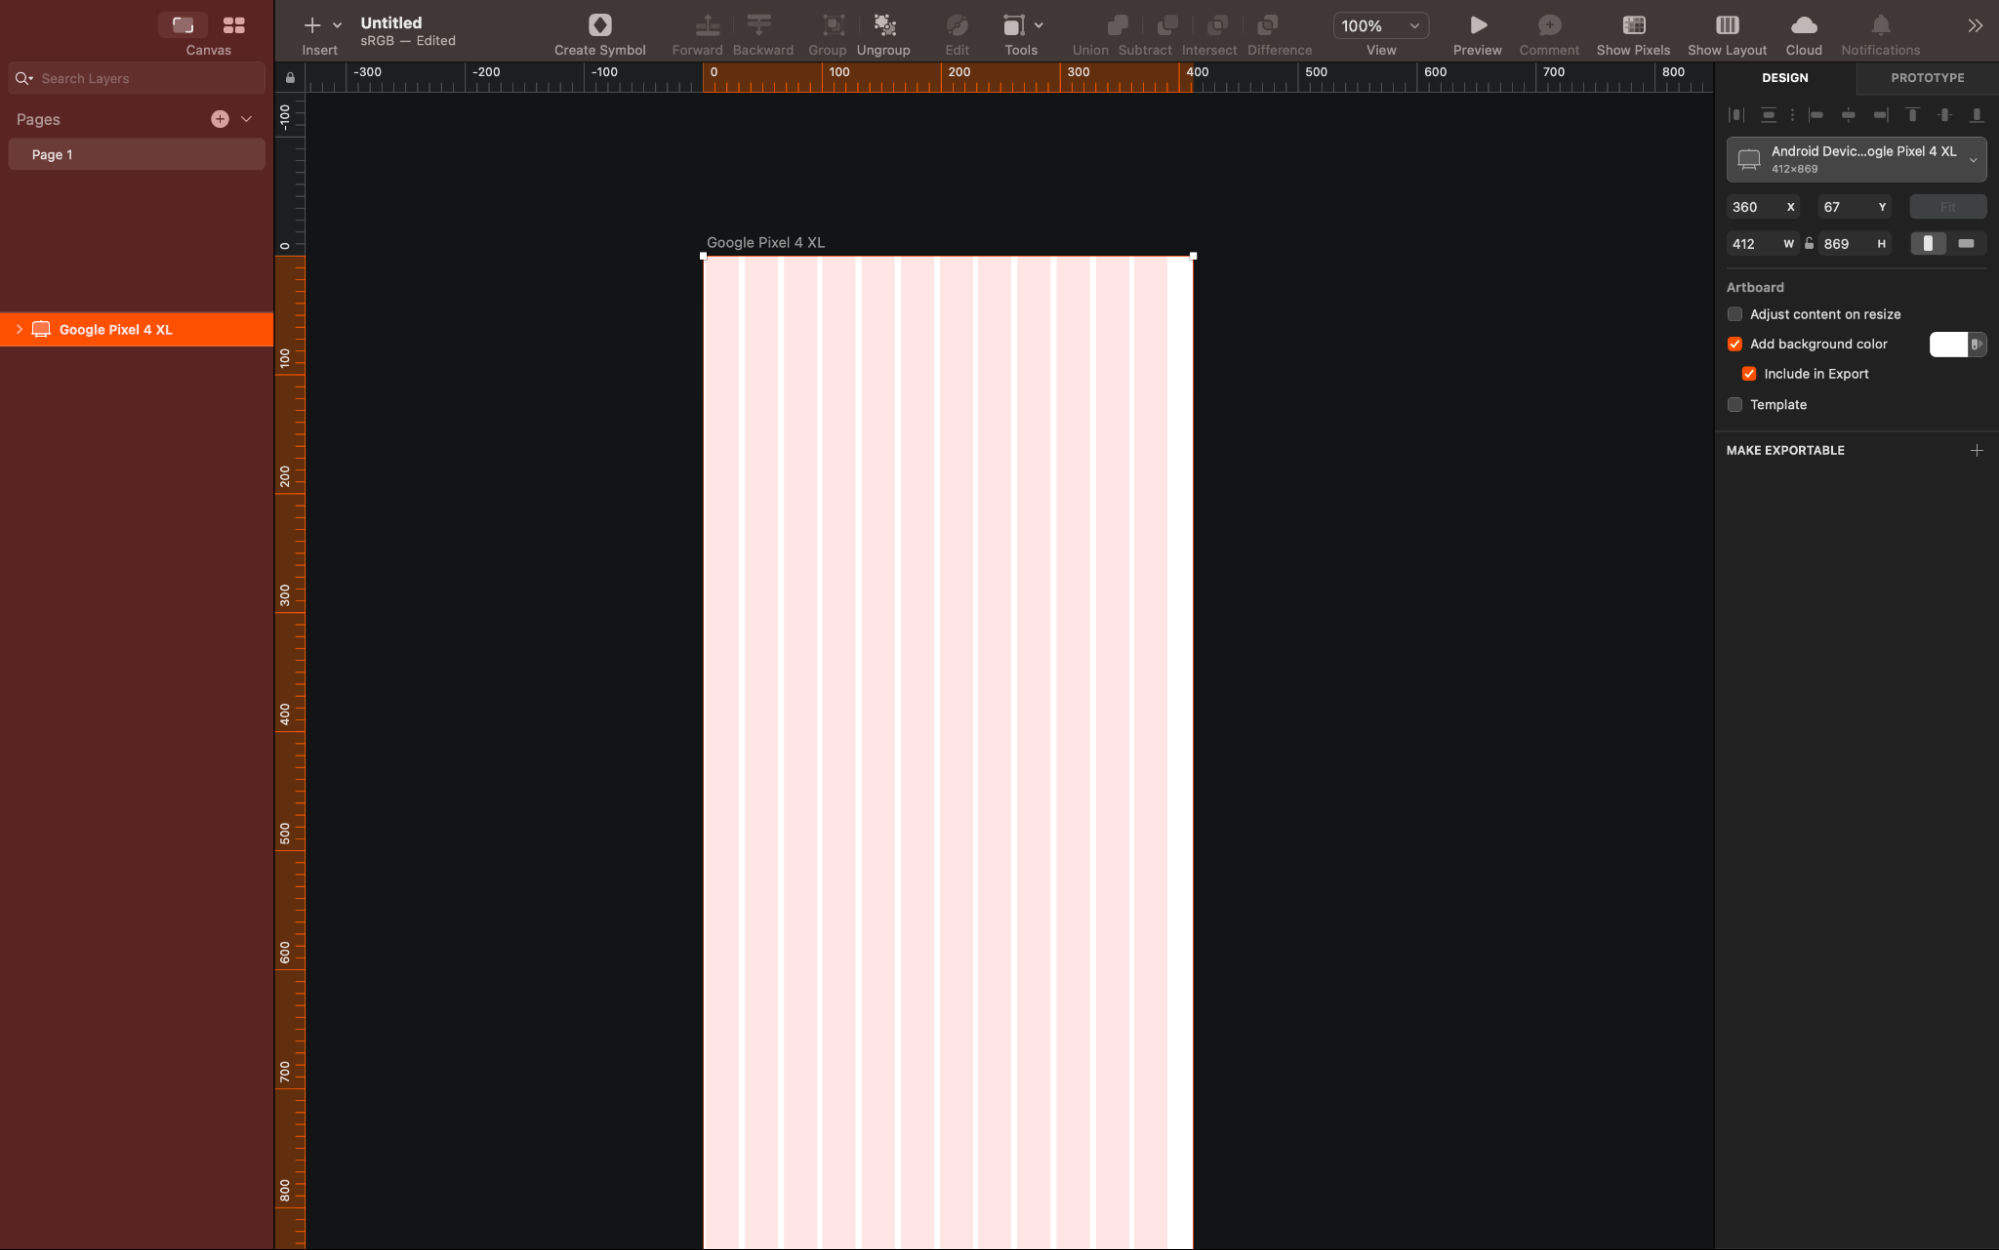
One neat point about artboards is how they work as the screens of your application. To create a new artboard, first just press 'A,' and a list of preset screen sizes for various platformsappear in the top-right corner for your pleasure and decision-making. You can select any preset or create a customized size, and all your application screens can exist within a single Sketch file—and it’s a pretty neat plus that makes it easier to manage your project.
Pages in Sketch represent different platforms or resolutions. For example, you might have one page for iOS designs and another for Android, and so you can house an entire project within a single Sketch file. What’s more, you can switch between pages fast through the dropdown or the keyboard shortcuts Fn ↑ and ↓.
Templates are often a designer’s best friend, since it’s so nice when you’ve got something “prefabbed” to reach for. Sketch has preloaded UI templates for iOS, Material Design, and Responsive Web, which you can access through File > New From Template. You can also add your own templates, downloaded from the web.
When you’re designing for iOS, it's best to start at 1x resolution, and that’s preferably from using the iPhone 8 screen size as a reference (375 x 667 pt). Remember a little golden rule here that 1 px in Sketch equals 1 pt on the device screen.
Alignment, Distances, and Guides
Sketch provides you with various tools that help you design with precision, and Smart Guides help align your elements. The Distances feature measures the space between layers, and rulers help to create guides for your design.
Layout settings allow you to set up your own grid system. It’s a nifty plus that’s especially useful whenever you’re designing for larger screens that call for clean divisions, and for those we can think of web interfaces or tablet screens.
How to Work With Text
To add text to your design, you press 'T' and the inspector lets you select the font and adjust the styles. Text styles in Sketch work similarly to CSS, which allows you to apply consistent styles across multiple text layers.
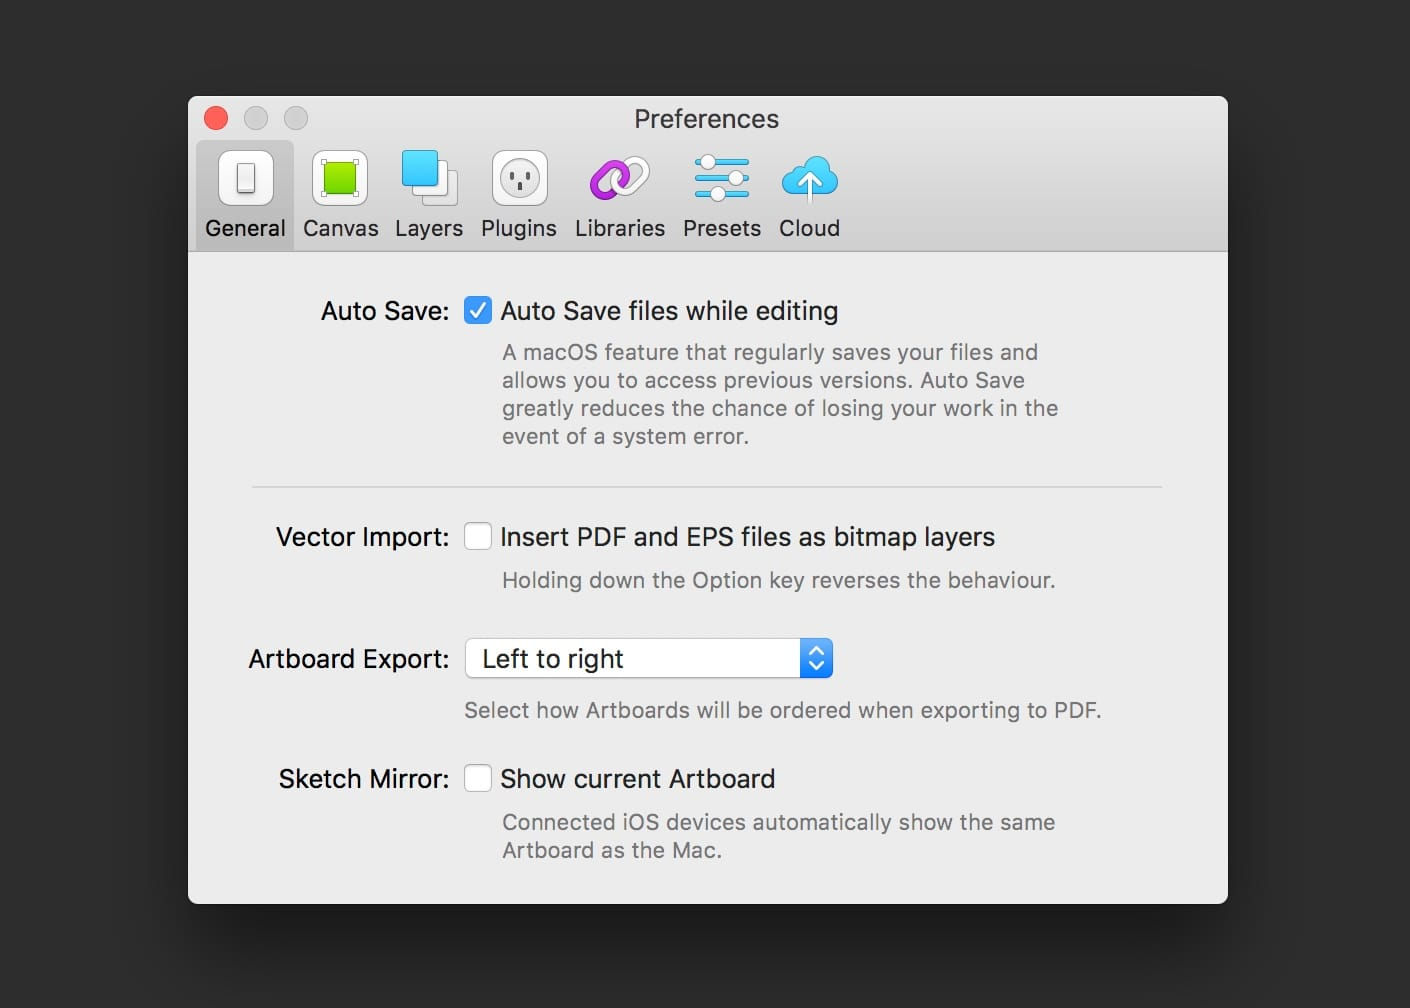
Preferences
Set up your preferences according to your needs. This includes enabling Auto-Save to protect your work, adjusting Pixel Fitting for sharper designs, and setting up the color and gradient palettes you find preferable.
Use the color picker to pick and save your preferred colors. Sketch also has an eyedropper tool to pick colors with from anywhere within or outside the application. On a similar note, you can apply gradients to your designs to add depth and visual interest.
Remember, practice is essential to mastering Sketch. Take the time to explore each feature and try out different tools and settings to see what works best for you, so you can produce deliverables that are both functional and impactful.
The Take Away
In any trade where professionals create, modify, or fix things, tools are essential. Knowing which tools to use for which tasks, along with the key principles and theory behind the work, is just as important. Digital design is no different. For UX and UI designers, having the right tools can make a huge difference, enabling you to craft innovative, user-friendly designs that delight your audience and bring them closer to your brand.
Because the nature of the industry is tech-based, it takes keeping a finger on the pulse of the latest tools and technologies and an eye on which features can serve you best in a project. We've given you a list of some neat and handy and popular tools here.
We would love to hear from you about your experiences with these tools. You can share your thoughts, insights, and tips in the comments section. This will not only help us but also benefit the wider design community.
Remember, this article is an evergreen resource, and we'll be updating it regularly to reflect the newest trends and tools in the UX/UI design world. So, do check back often for the latest information.
As the UX/UI design field grows, so does the demand for skilled professionals. Whether you're starting out or looking to upskill, our courses can provide the knowledge and skills you need to excel in this exciting industry.
Stay creative, stay curious, and most importantly, keep designing!
Feel Stuck? Want Better Job Options?
AI is replacing jobs everywhere, yet design jobs are booming with a projected 45% job growth.
With design skills, you can create products and services people love. More love means more impact and greater salary potential.
At IxDF, we help you from your first course to your next job, all in one place.
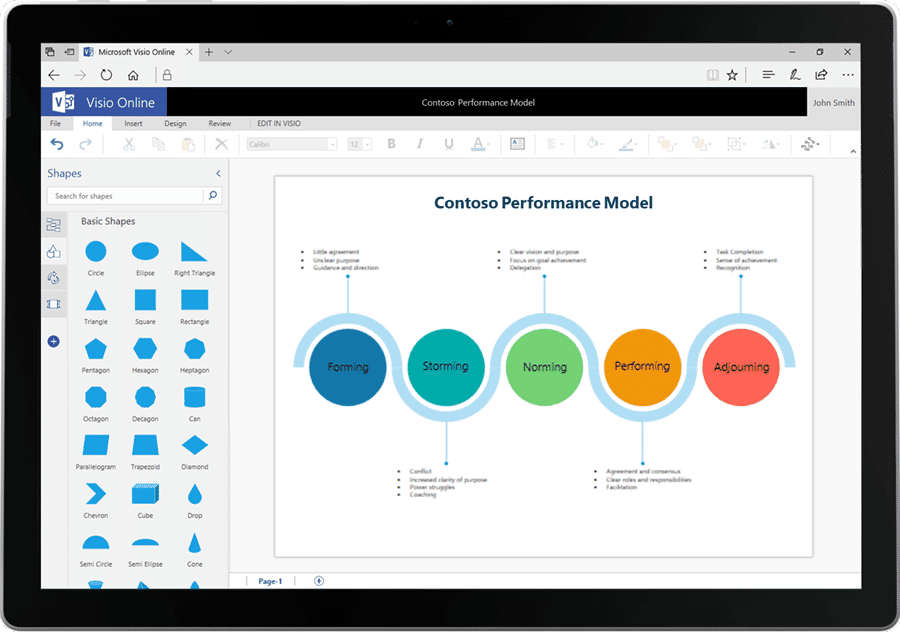 Author/copyright holder: Microsoft. Copyright terms and license: Fair Use.